Mission
The Center for Excellence in Education (CEE) has been contributing to the scientific leadership of the United States since its founding in 1983. CEE nurtures academically talented students, providing them with programs that challenge and prepare them to become future leaders in STEM fields. By offering programs at no cost, CEE aims to foster skills in creation, invention, and scientific leadership through various educational initiatives.
Basic Information
Tax-Exempt
Founded in
1982
EIN
52-1256563
Total Assets
$8.695 million
UN Sustainable Development Goals Supported
This organization contributes to the following United Nations Sustainable Development Goals. See the SDG page for more information.
Showing 3 of 3 goals
At a Glance

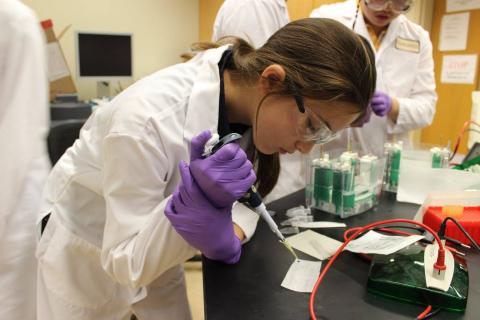
Research Science Institute
The RSI program immerses students in advanced STEM education through a combination of coursework and research.
USA Biolympiad
Exploring the world of biology, the USABO prepares students for international competition.
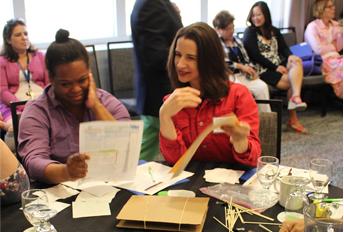
Teacher Enrichment Program
TEP enriches teachers and extends opportunities for underserved students.
Impact Stats
2900
Participants
Research Science Institute
RSI has provided STEM mentorships and research opportunities to over 2900 high school students.
100,000
Participants
USA Biolympiad Program
Over 100,000 high school students have explored the world of biology as part of USABO.
680,000
Students Enriched
Teacher Enrichment Program
Provided enrichment to teachers of over 680,000 underserved middle and high school students.
Our Programs
Research Science Institute
A six-week summer program offering students advanced STEM coursework and research experiences.
Learn MoreUSA Biolympiad
Competitions leading to the selection of the U.S. team for the International Biology Olympiad.
Learn MoreTeacher Enrichment Program
Professional development for teachers aiming to enhance STEM education.
Learn More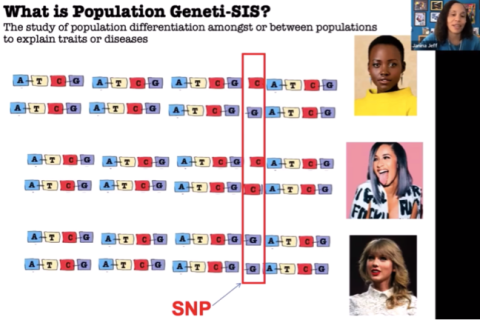
STEM Lyceums
A virtual club designed to foster STEM communities among high school students.
Learn MoreMIP Score (Beta)
The MIP Score is in beta! We'd love any feedback you may have.
The MIP Score and it's methodology is purely used as a way to visualize how a nonprofits public financial data compares against others. It doesn't reflect the unique circumstances and impact that a nonprofit has.The MIP Score should never be used to say one charity is better than another.
Overall Score
65
70
/100
Program Expense Ratio
82.39%
14
/20
Program Revenue Growth
36.38%
18
/20
Leverage Ratio
0.06821
20
/20
Working Capital Ratio
2.757
16
/20
Fundraising Efficiency
0
2
/20
Latest Filing Data: Form 990
Fiscal Year:2022
Source:Source: Self-reported by organization
Financial Details
Revenue
| Category | Amount | Percentage |
|---|---|---|
| Contributions, Gifts, and Grants | 2.489M | 70.95% |
| Program Services | 867.9K | 24.74% |
| Investment Income | 151K | 4.31% |
| Sales of Non-Inventory Assets | 0 | 0.00% |
| Other Notable Sources | 0 | 0.00% |
| Total Revenue | 3.508M | 100.00% |
Related Nonprofits
Center for Excellence in Education
Science & Tech
Mathematics ResearchMontana Council of Teachers of Mathematics
Science & Tech
Mathematics ResearchInitiative for Mathematics Learning by Inquiry Inc.
Science & Tech
Mathematics ResearchAspen Center for Physics
Science & Tech
Mathematics ResearchAssociation for Women in Mathematics Inc.
Science & Tech
Mathematics Research