Mission
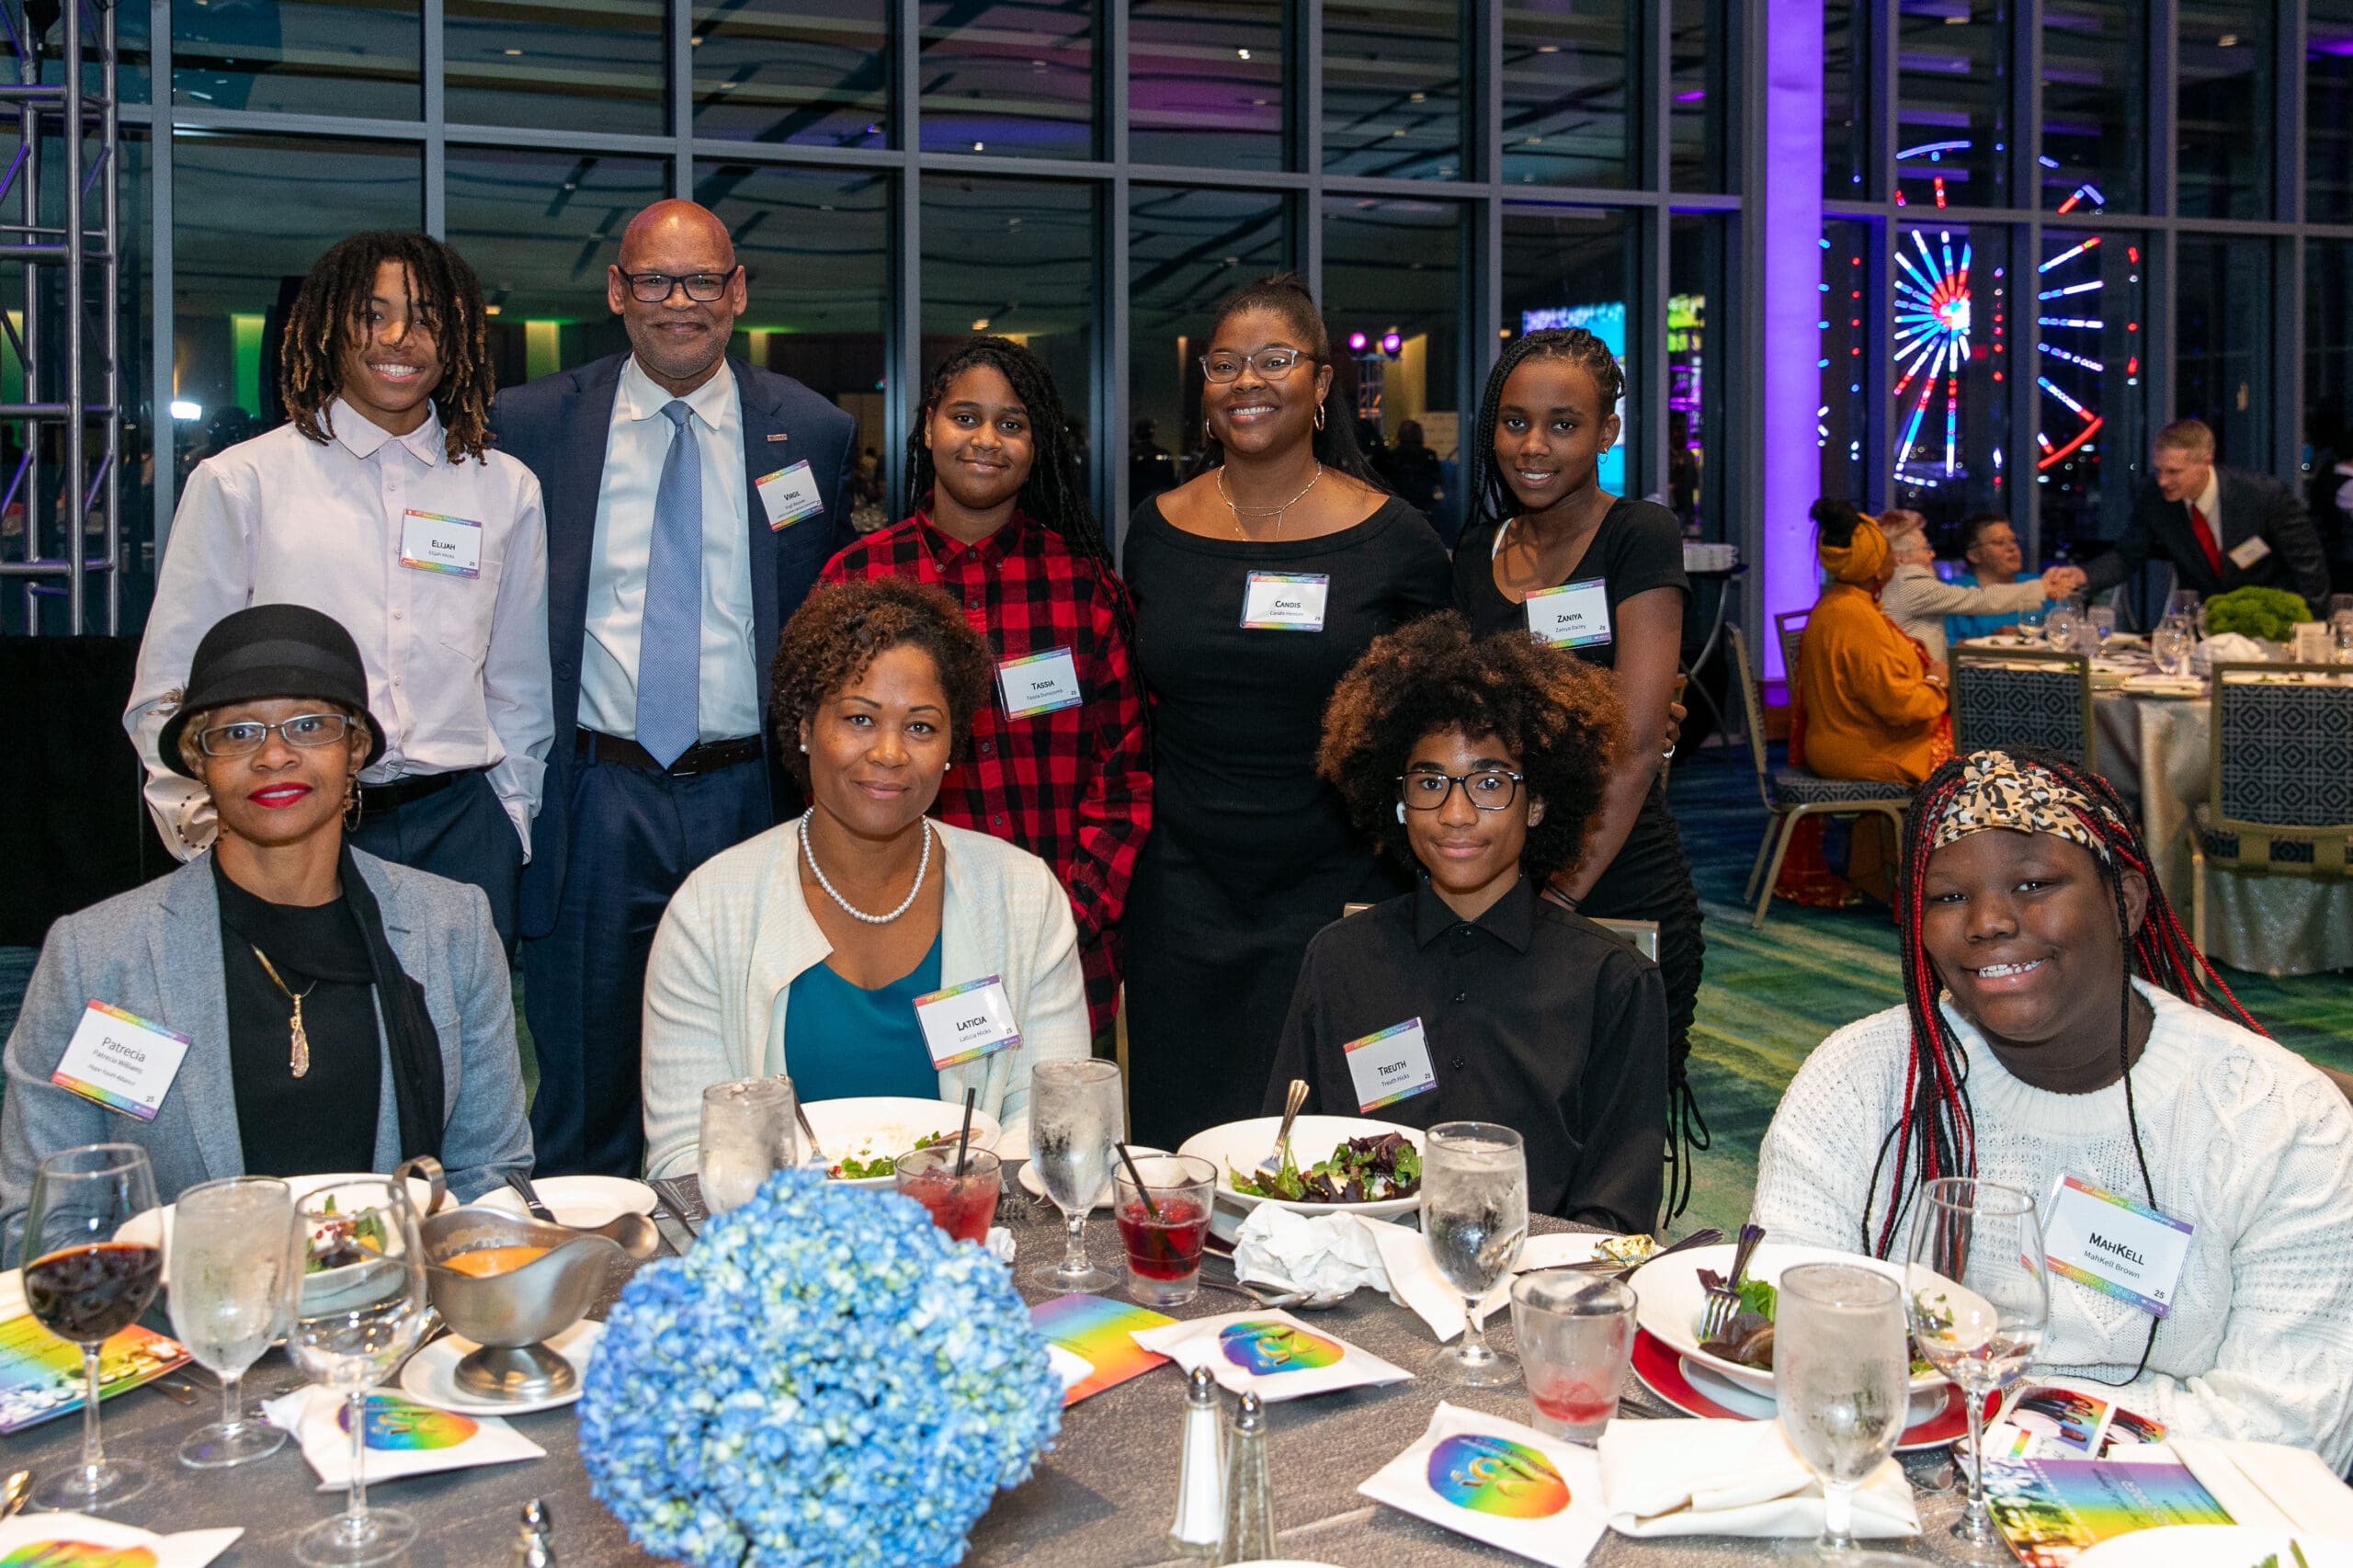
Since 1992, CADCA has demonstrated that when all sectors of a community come together, social change happens. CADCA represents over 7,000 community coalitions in more than 30 countries worldwide, uniting individuals from key sectors including schools, law enforcement, youth, parents, healthcare, and tribal communities to prevent substance misuse through collaborative efforts.
Basic Information
Tax-Exempt
Founded in
1992
EIN
54-1610317
Total Assets
$14.01 million
UN Sustainable Development Goals Supported
This organization contributes to the following United Nations Sustainable Development Goals. See the SDG page for more information.
Showing 3 of 3 goals
At a Glance
Latest News and Impact Stories
Stay updated on CADCA's impact, initiatives, and success stories through their blog.
Upcoming Events
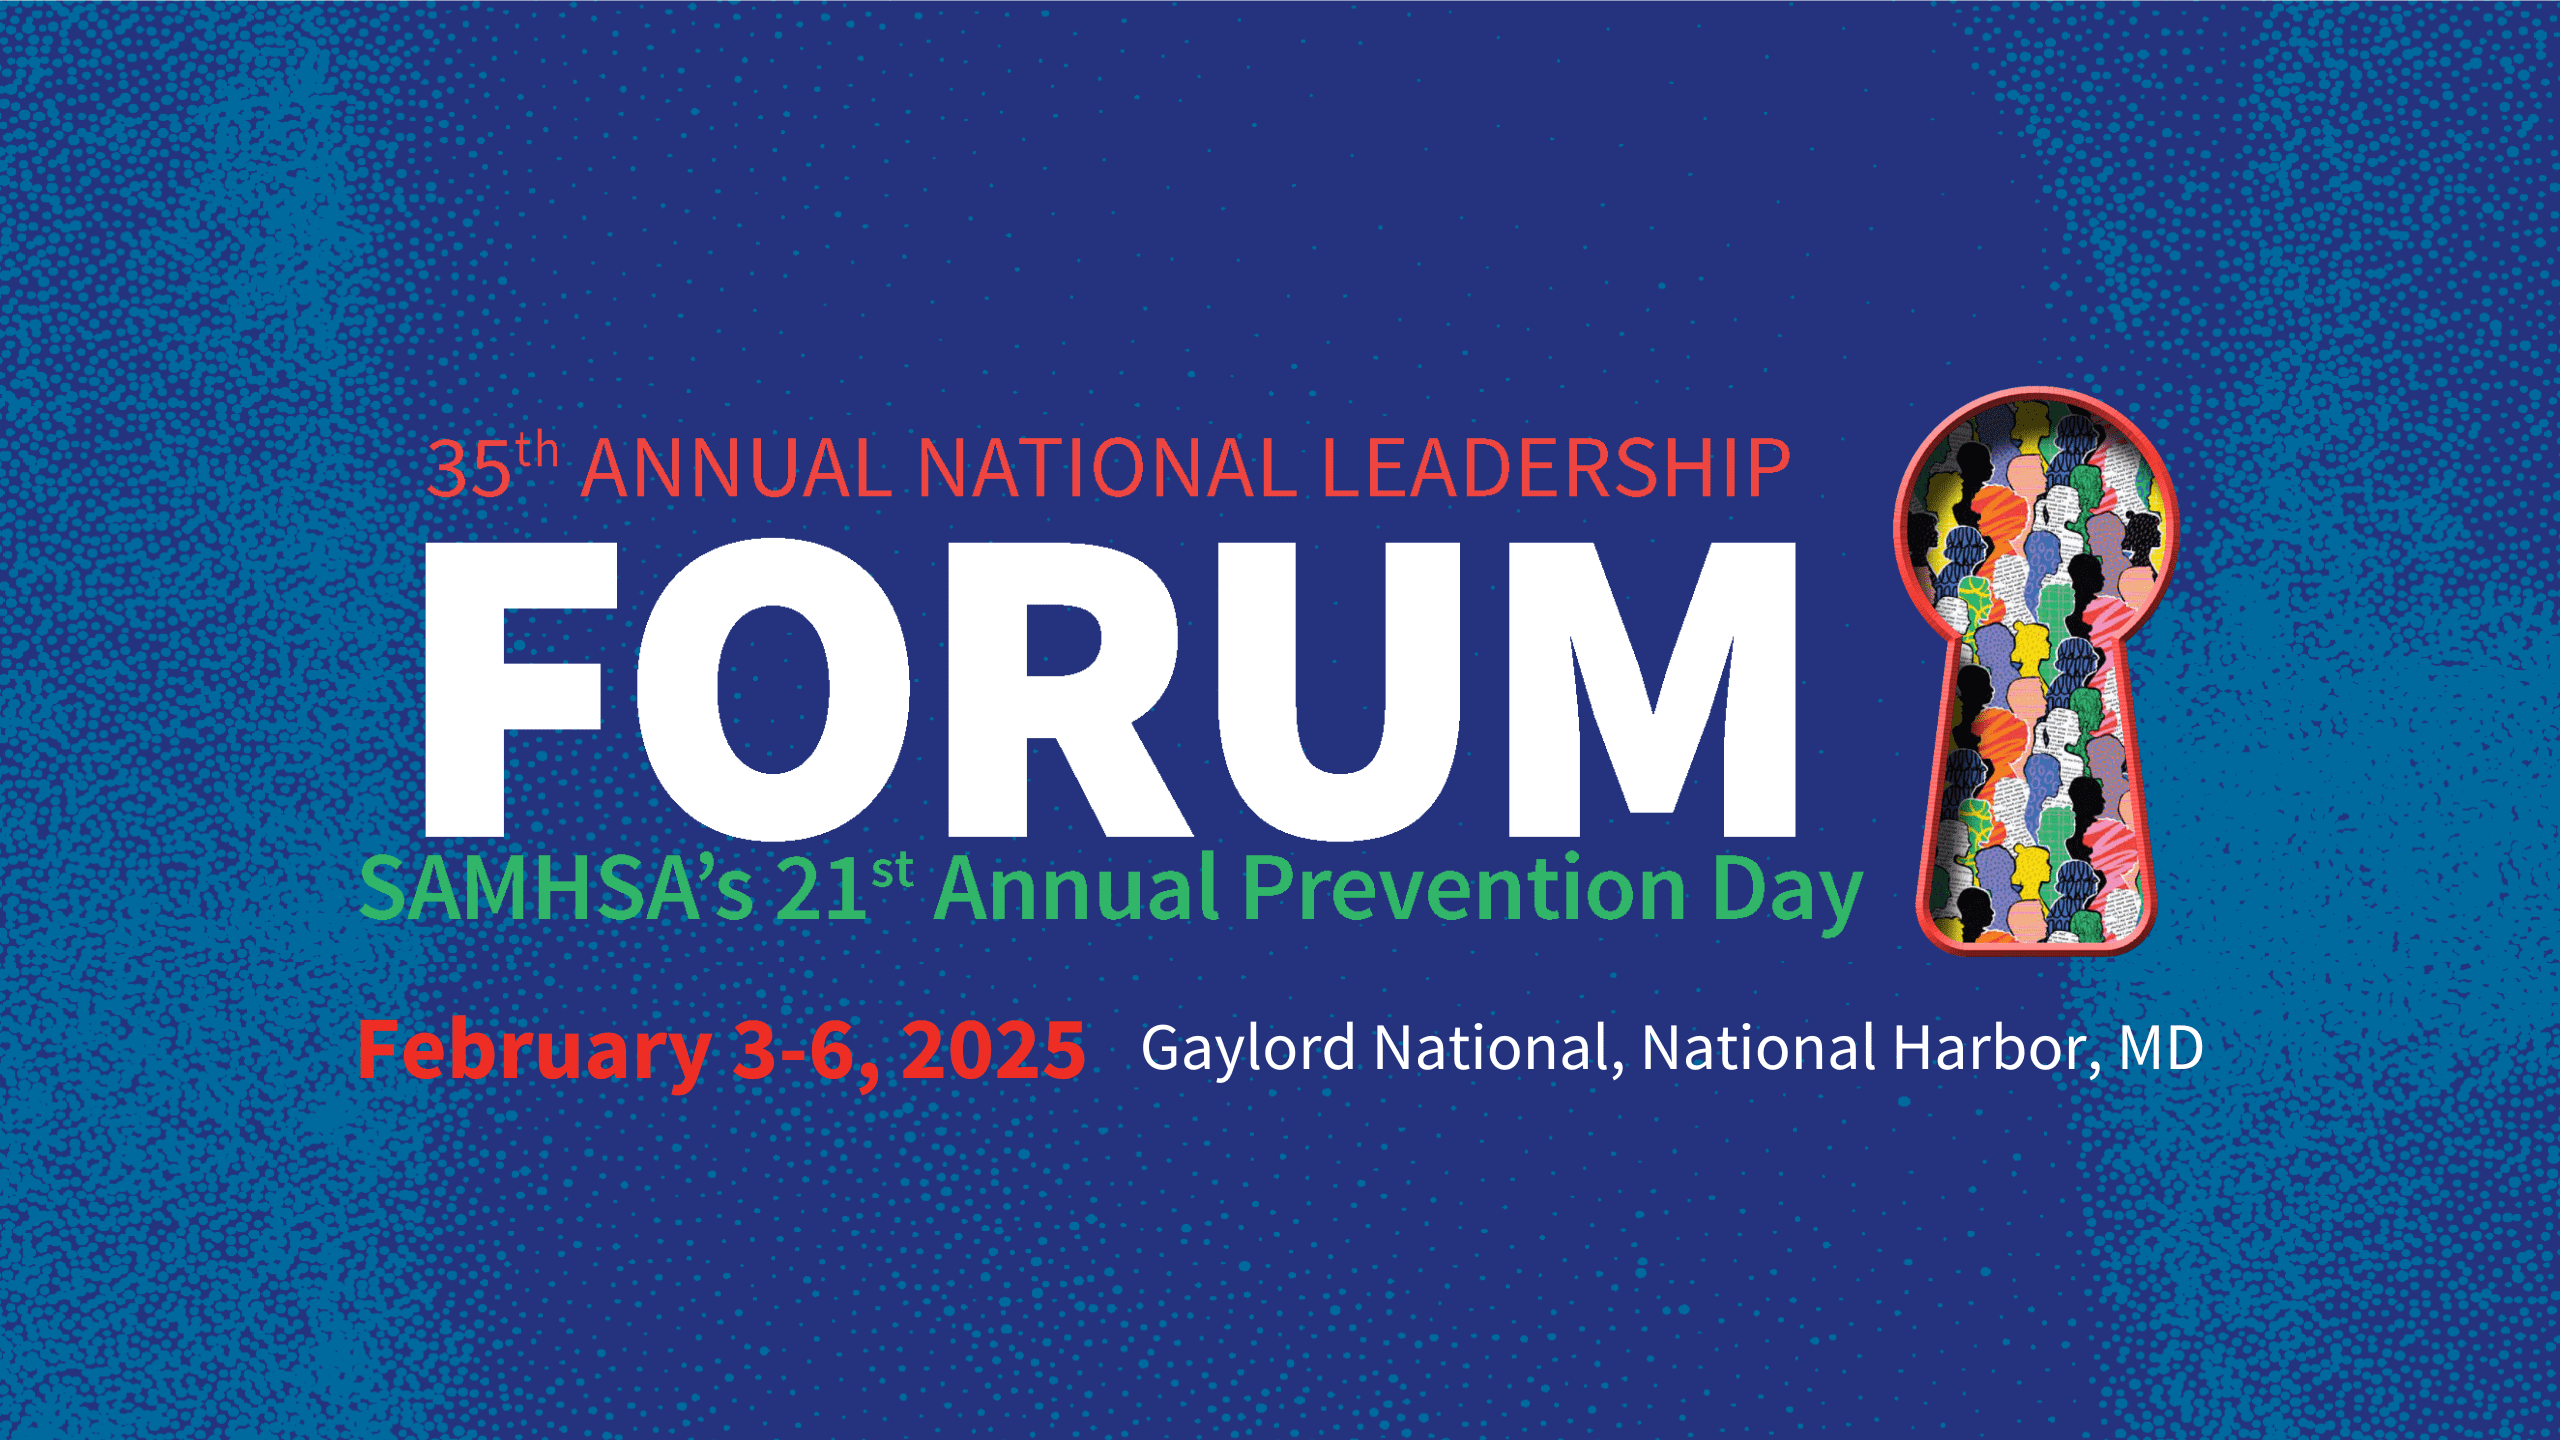
Join CADCA’s 35th Annual National Leadership Forum for networking and training.
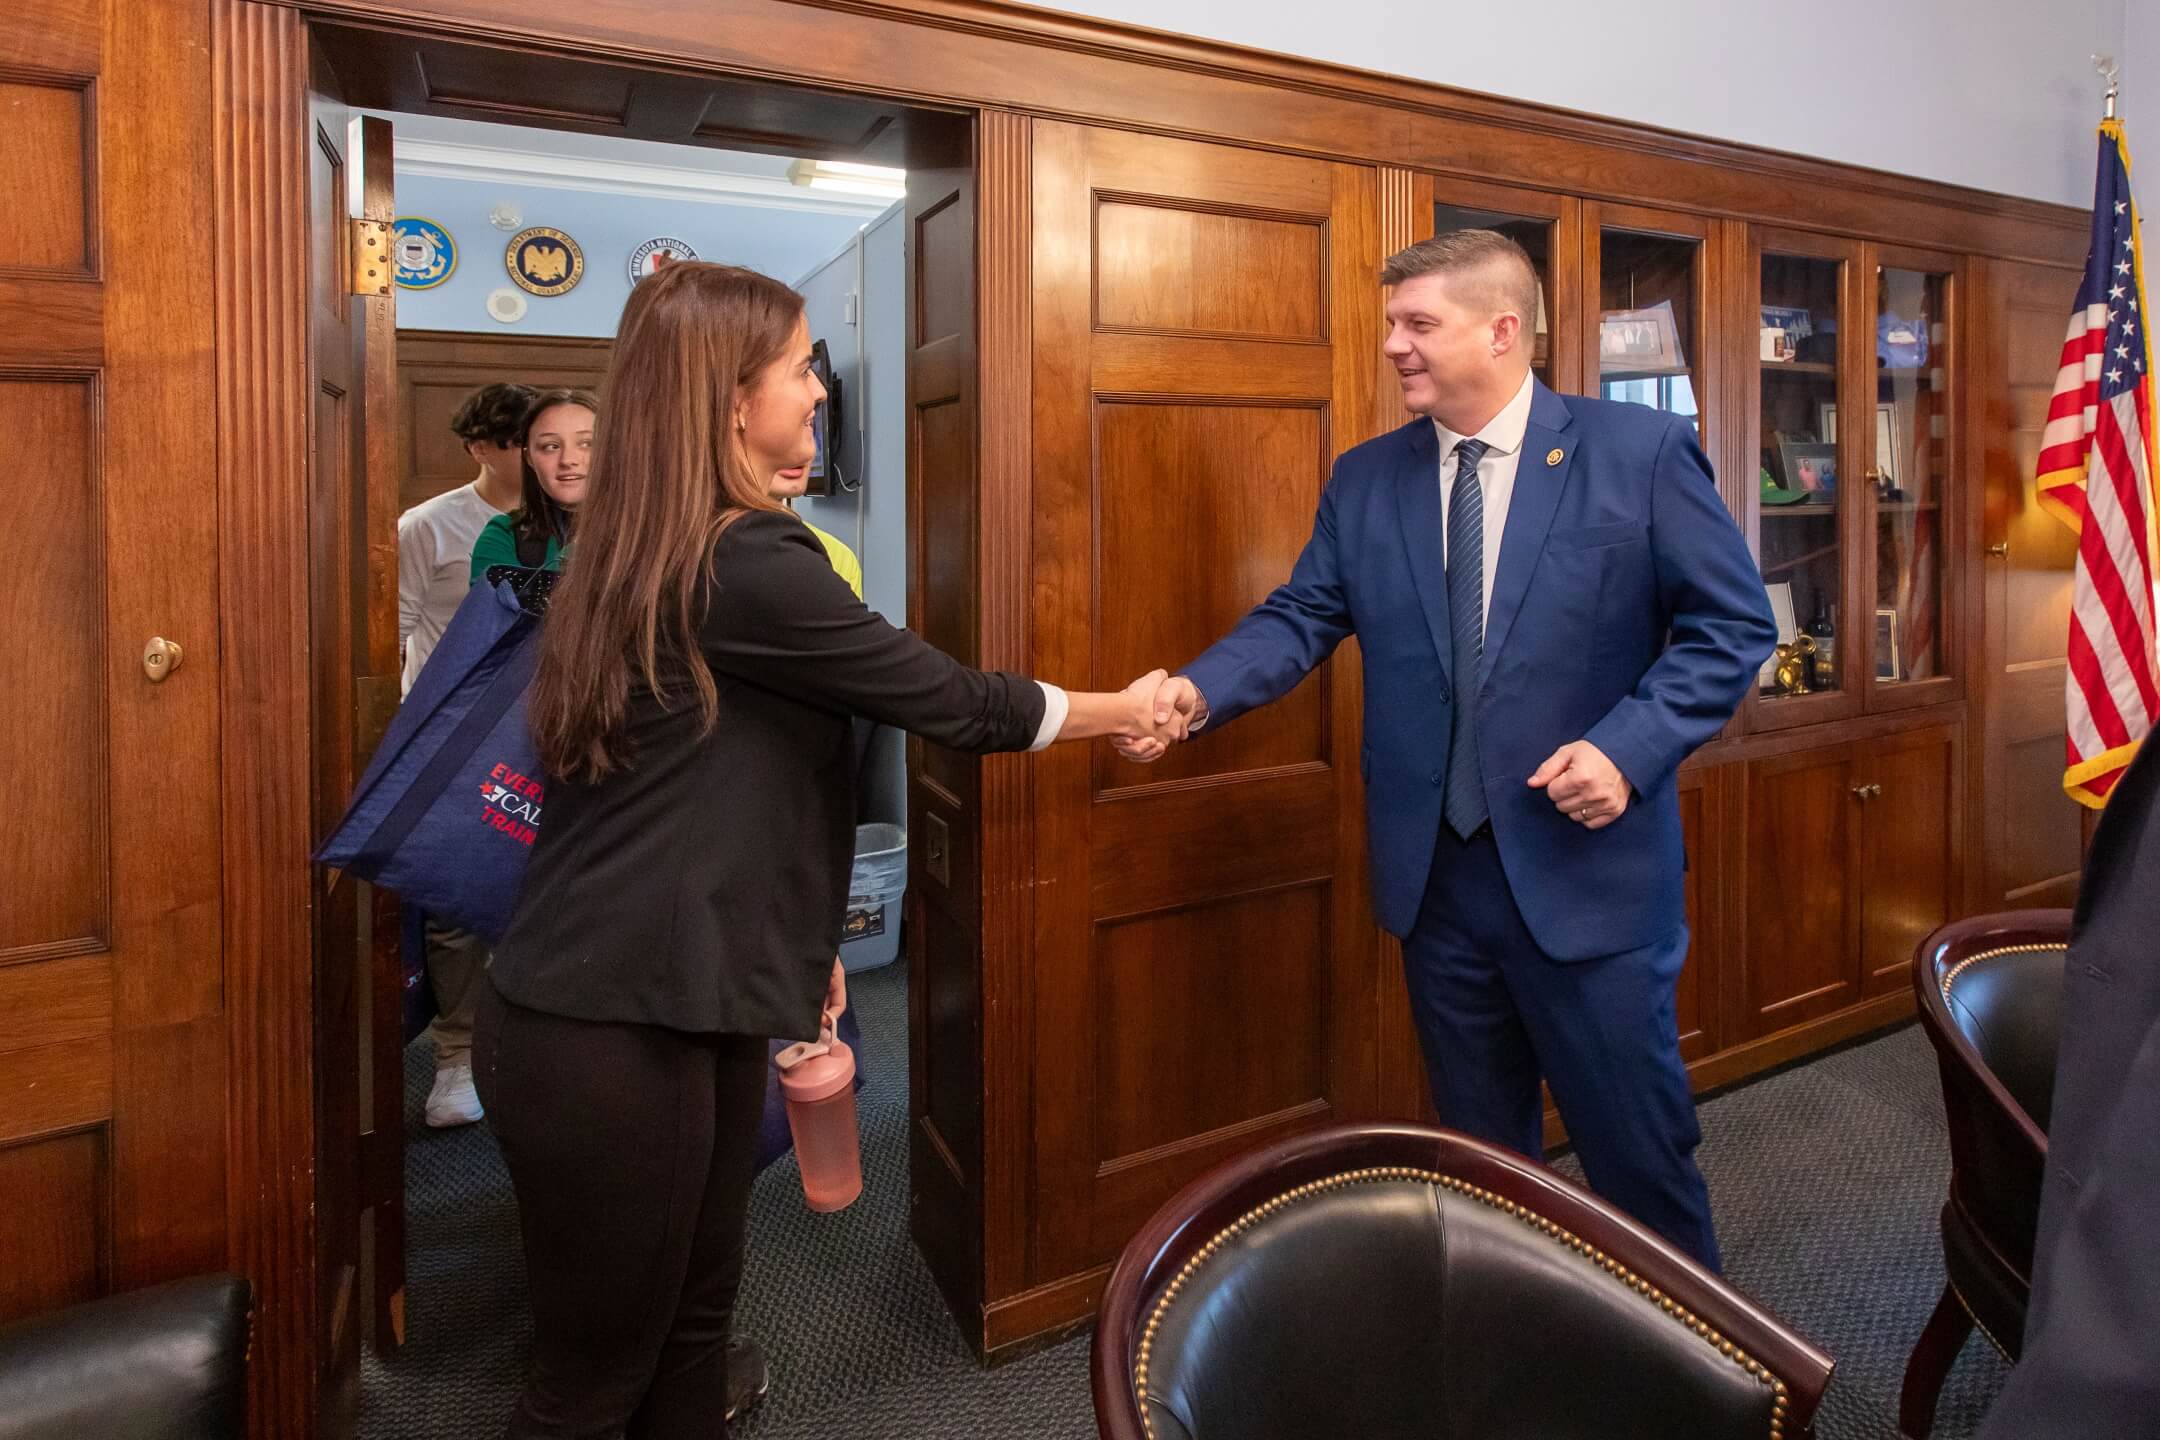
Advocacy Efforts
CADCA empowers community coalitions to advocate for effective drug misuse prevention.
Impact Stats
14,000
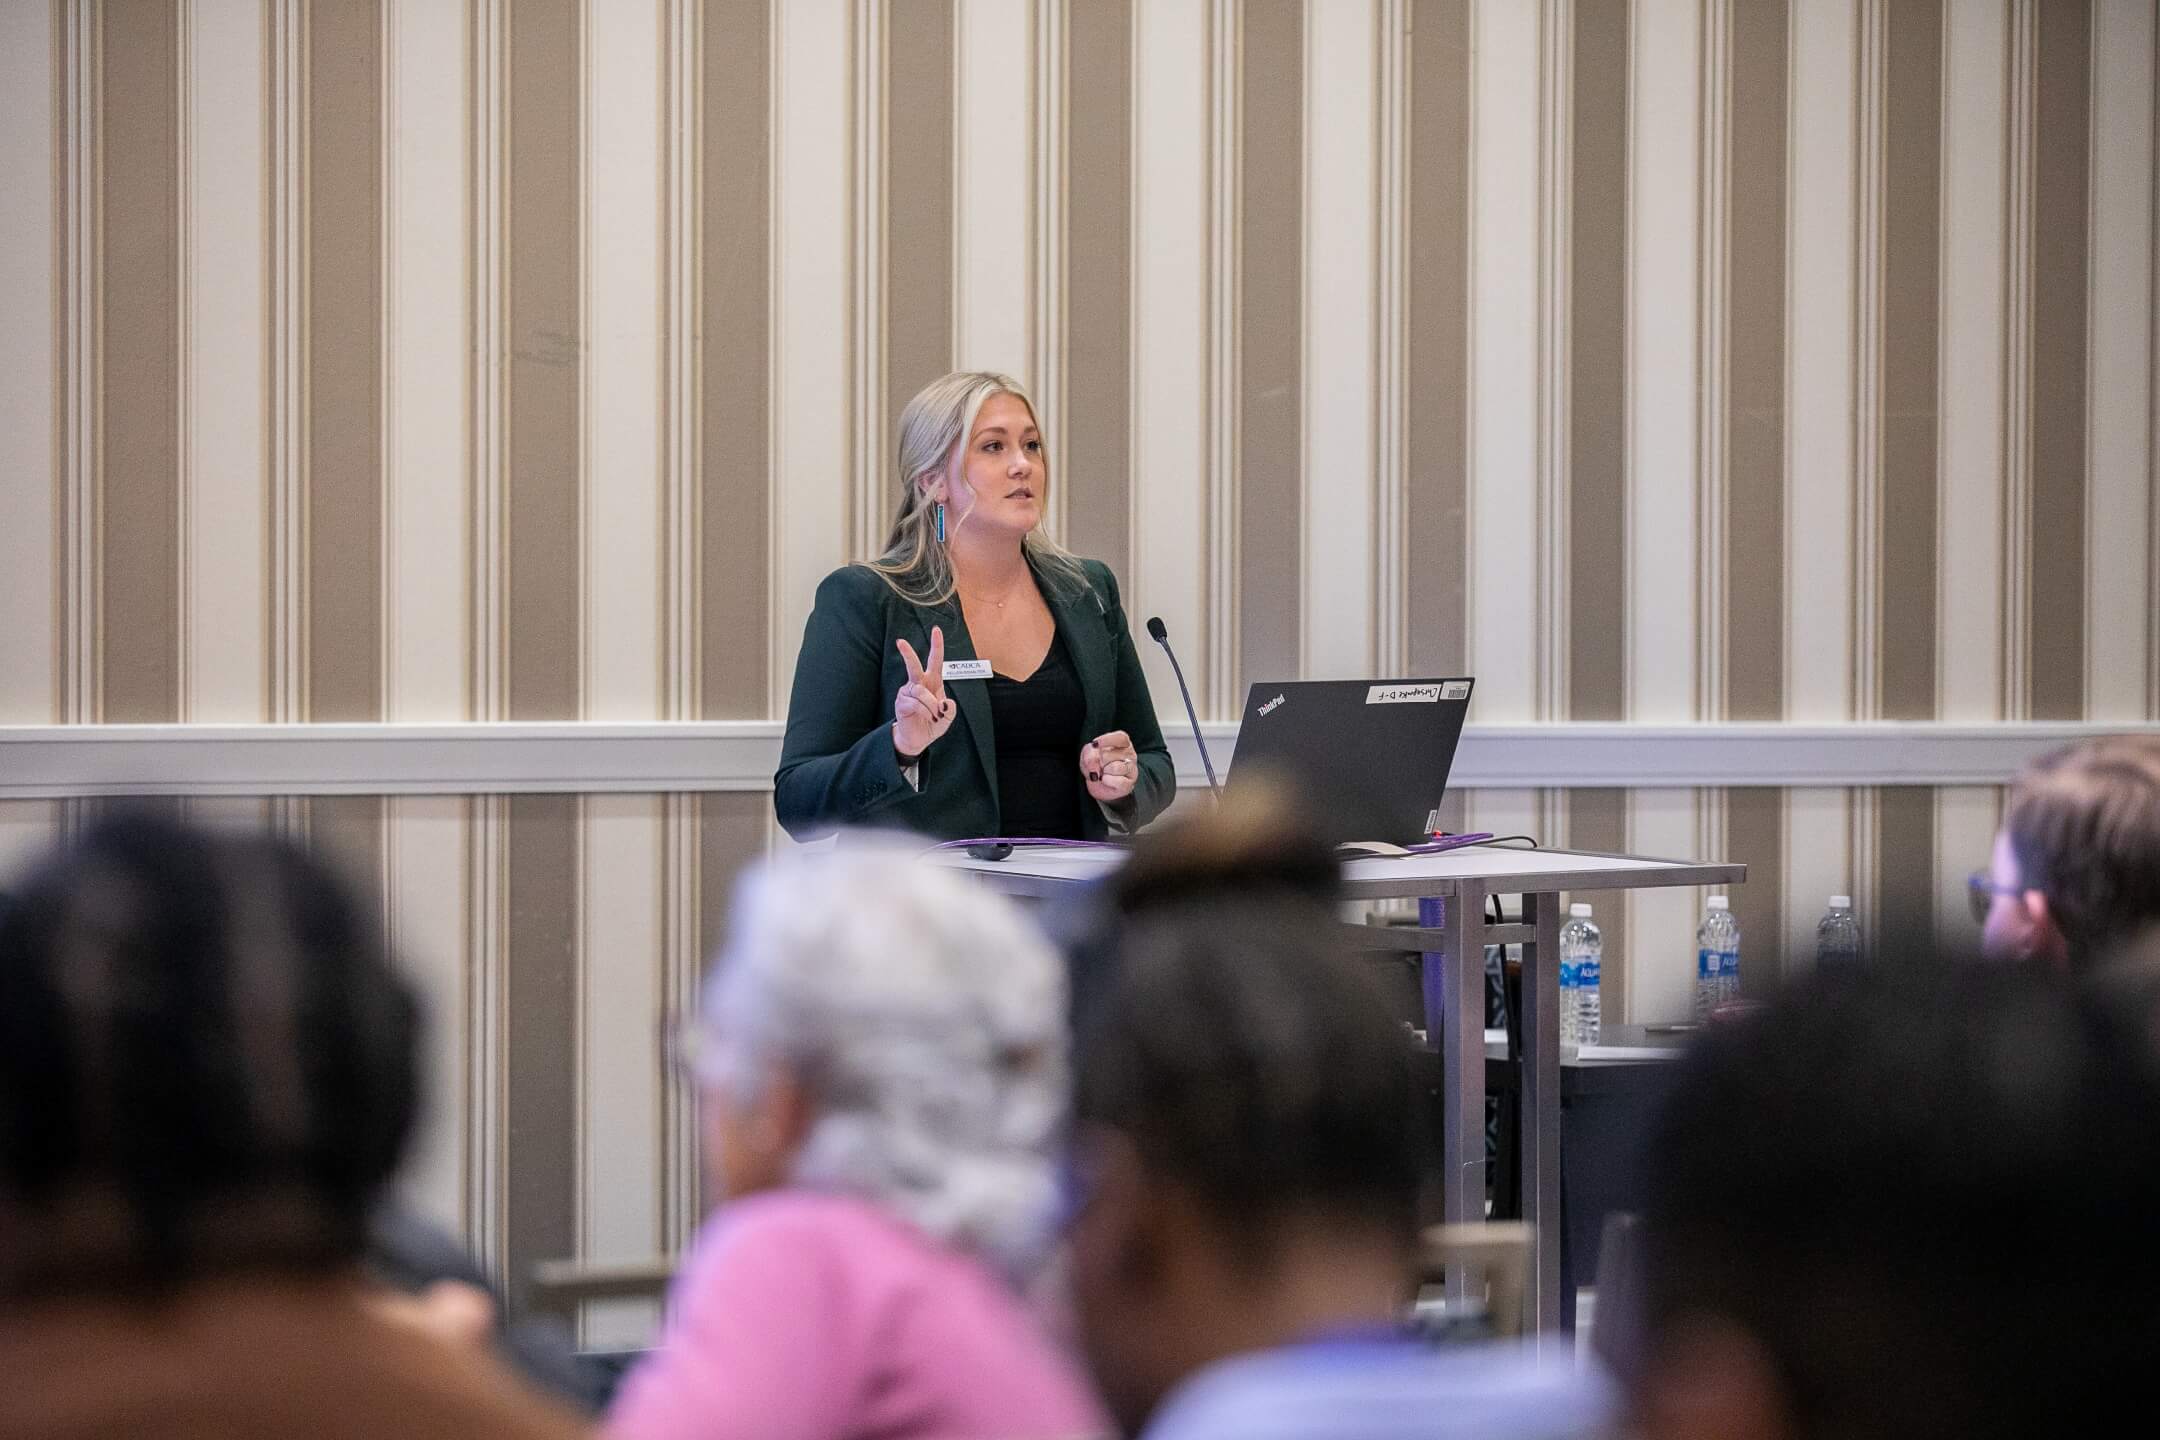
Total Professionals Trained
Professionals Trained
CADCA has trained over 14,000 professionals worldwide.
7,000
Total Community Coalitions
Community Coalitions
CADCA represents over 7,000 community coalitions globally.
28
Countries Reached
Global Reach
CADCA has a presence in 28 countries around the world.
Past Events
Annual National Leadership Forum
February 3-6, 2025
Annual National Leadership Forum bringing together coalitions to discuss strategies.
Stronger Together Webinar
November 26, 2024
Webinar on leveraging school-community partnerships for prevention success.
CADCA Screening: Screenagers
December 5, 2024
Webinar screening discussing drug influences on youth.
Our Programs
Youth Leadership Training
Empowering youth leaders to advocate for substance misuse prevention.
Learn MoreCoalition Building Initiative
Supporting the formation and sustainability of community coalitions.
Learn MoreTestimonials
"CADCA has been instrumental in our coalition’s success."
Leanne Reid
Co-Prevention Coordinator, Prevent Coalition
MIP Score (Beta)
The MIP Score is in beta! We'd love any feedback you may have.
The MIP Score and it's methodology is purely used as a way to visualize how a nonprofits public financial data compares against others. It doesn't reflect the unique circumstances and impact that a nonprofit has.The MIP Score should never be used to say one charity is better than another.
Overall Score
66
42
/100
Program Expense Ratio
66.75%
6
/20
Program Revenue Growth
2.71%
10
/20
Leverage Ratio
0.5429
8
/20
Working Capital Ratio
0.446
6
/20
Fundraising Efficiency
1.072
12
/20
Latest Filing Data: Form 990
Fiscal Year:2022
Source:Source: Self-reported by organization
Financial Details
Revenue
| Category | Amount | Percentage |
|---|---|---|
| Contributions, Gifts, and Grants | 11.12M | 72.35% |
| Program Services | 4.268M | 27.76% |
| Investment Income | 80.1K | 0.52% |
| Sales of Non-Inventory Assets | -52.45K | -0.34% |
| Other Notable Sources | 26.31K | 0.17% |
| Total Revenue | 15.37M | 100.00% |
Related Nonprofits
Hershey Rev Charitable Trust
Philanthropy
General Named TrustCommunity Anti-Drug Coalitions of America
Philanthropy
General Named TrustAssociated Builders & Contractors of Hawaii Educational Tr 070190
Philanthropy
General Named TrustCopperleaf Charitable Foundation Inc.
Philanthropy
General Named TrustJames C Dunbar Trust
Philanthropy
General Named Trust