Mission
Evidence Action scales low-cost health interventions that improve the wellbeing of hundreds of millions of people in Africa and Asia. They use rigorous research to find effective solutions, test them in real-world scenarios, and scale up those that deliver impactful outcomes. Their focus areas include child and adolescent health, clean water, maternal and newborn health, neglected tropical diseases, and nutrition.
Basic Information
Tax-Exempt
Address
1133 Connecticut Ave NW, Washington, District of Columbia, 20036
View all Washington charitiesFounded in
2011
EIN
90-0874591
Total Assets
$179.4 million
UN Sustainable Development Goals Supported
This organization contributes to the following United Nations Sustainable Development Goals. See the SDG page for more information.
Showing 2 of 2 goals
At a Glance

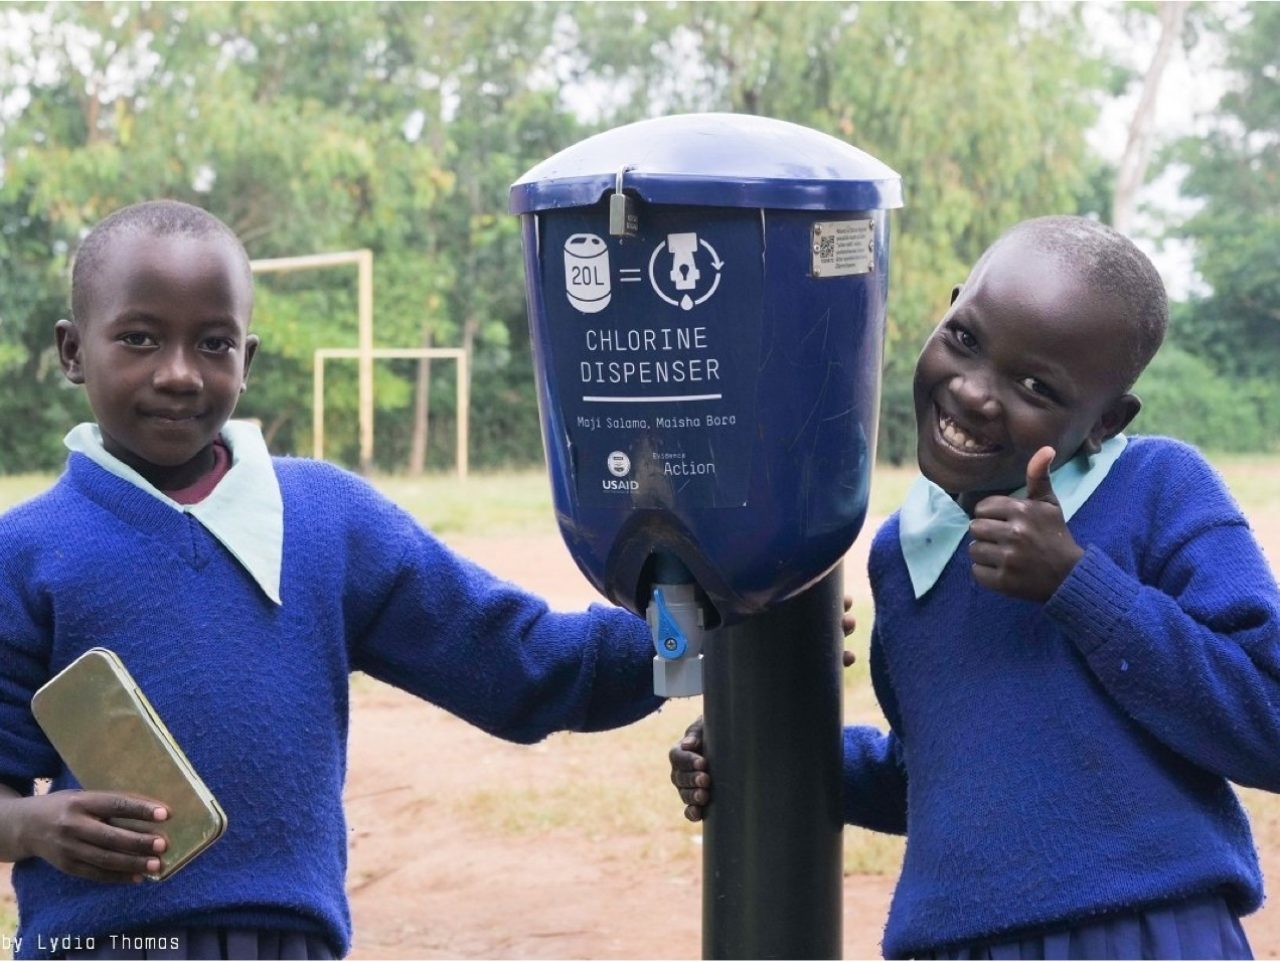
Safe Water Now
Their Safe Water Now program provides clean water to millions, leveraging low-cost chlorine dispensers to treat water sources in remote communities, ensuring access to safe drinking water.

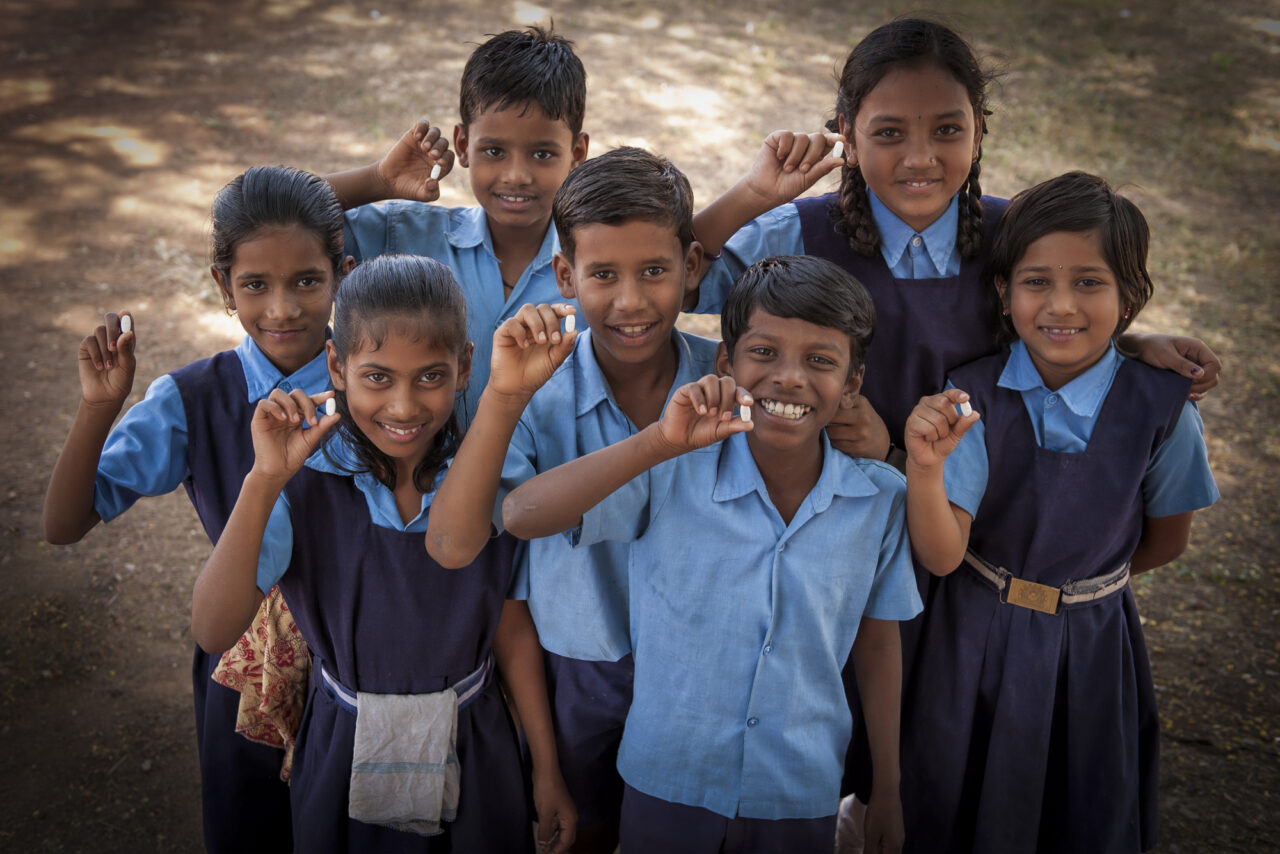
Deworm the World
This program provides mass deworming treatments to school-age children in high-risk areas, significantly improving health and educational outcomes by reducing parasitic infections.

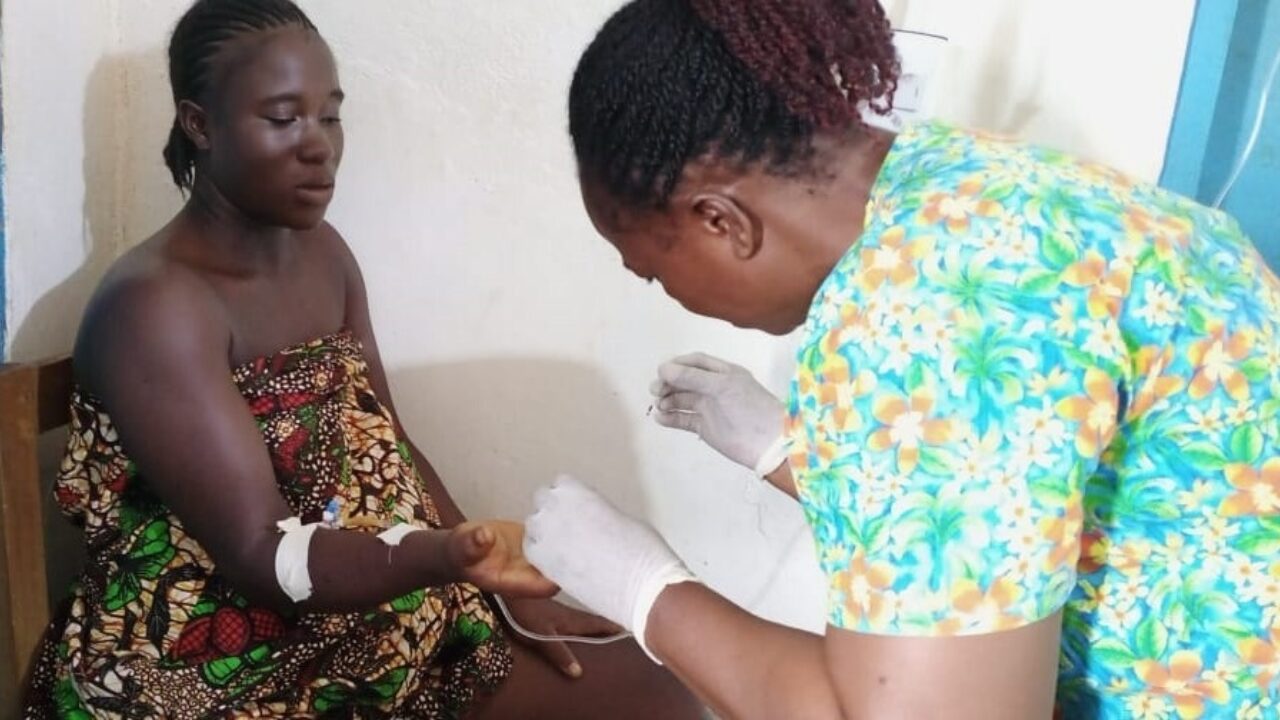
Syphilis-Free Start
This initiative screens and treats pregnant women for syphilis, preventing mother-to-child transmission and improving health outcomes for both mothers and babies.
Impact Stats
1B
deworming treatments
Deworming Treatments
They have delivered over 1 billion deworming treatments, generating $8 billion in productivity gains.
4M
people reached
Safe Water Access
They have provided access to safe water to more than 4 million people, helping to avoid countless cases of diarrheal disease.
5K
children saved
Lives Saved
Their health interventions have saved the lives of over 5,000 children under five years old
Past Events
10-Year Anniversary Celebration
10/10/2023
Marking a decade of their impactful work, Evidence Action shared stories and data collected from around the world, looking forward to even higher goals for the next decade.
Introduction of India Director
05/11/2024
Evidence Action’s new India Country Director was introduced in a 4-minute read announcement.
Impact Reports
MIP Score (Beta)
The MIP Score is in beta! We'd love any feedback you may have.
The MIP Score and it's methodology is purely used as a way to visualize how a nonprofits public financial data compares against others. It doesn't reflect the unique circumstances and impact that a nonprofit has.The MIP Score should never be used to say one charity is better than another.
Overall Score
66
56
/100
Program Expense Ratio
80.70%
14
/20
Program Revenue Growth
-43.68%
2
/20
Leverage Ratio
0.01343
20
/20
Working Capital Ratio
5.285
18
/20
Fundraising Efficiency
0
2
/20
Latest Filing Data: Form 990
Fiscal Year:2022
Source:Source: Self-reported by organization
Financial Details
Revenue
| Category | Amount | Percentage |
|---|---|---|
| Contributions, Gifts, and Grants | 127.2M | 97.66% |
| Program Services | 1.825M | 1.40% |
| Investment Income | 1.221M | 0.94% |
| Sales of Non-Inventory Assets | 7.426K | 0.01% |
| Other Notable Sources | 0 | 0.00% |
| Total Revenue | 130.2M | 100.00% |