Mission
Founded in 1991, the Employment Policies Institute (EPI) is a non-profit research organization focused on the impact of labor policies like minimum wage on job creation and employment. By sponsoring independent research from economists at major universities, EPI aims to inform public policy discussions and address the implications of mandates on employment growth and entry-level job opportunities.
Basic Information
Tax-Exempt
Founded in
1994
EIN
52-1902264
Total Assets
$1.205 million
At a Glance
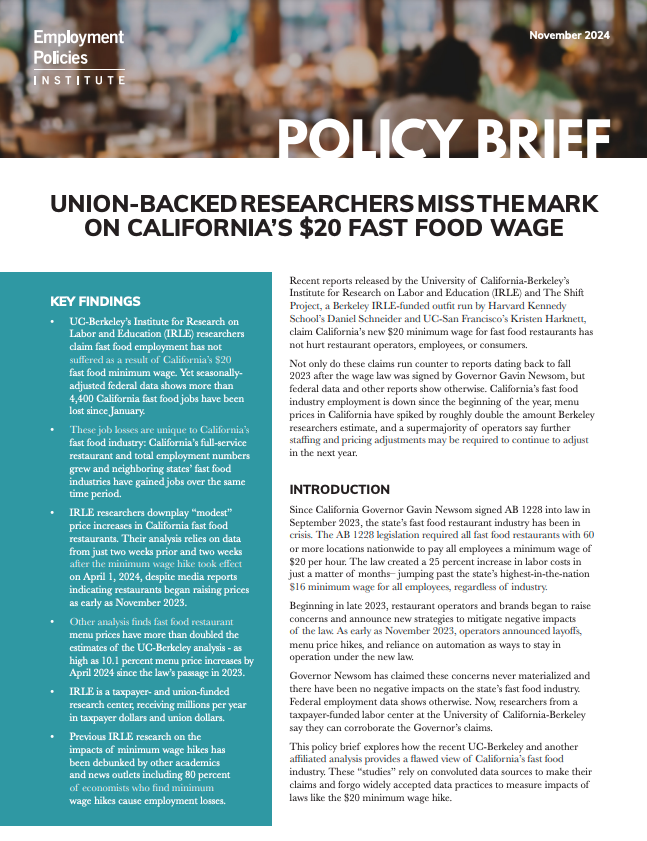
Research on California's $20 Fast Food Wage
A study that analyzes the negative impacts of California's $20 minimum wage for fast food restaurants.
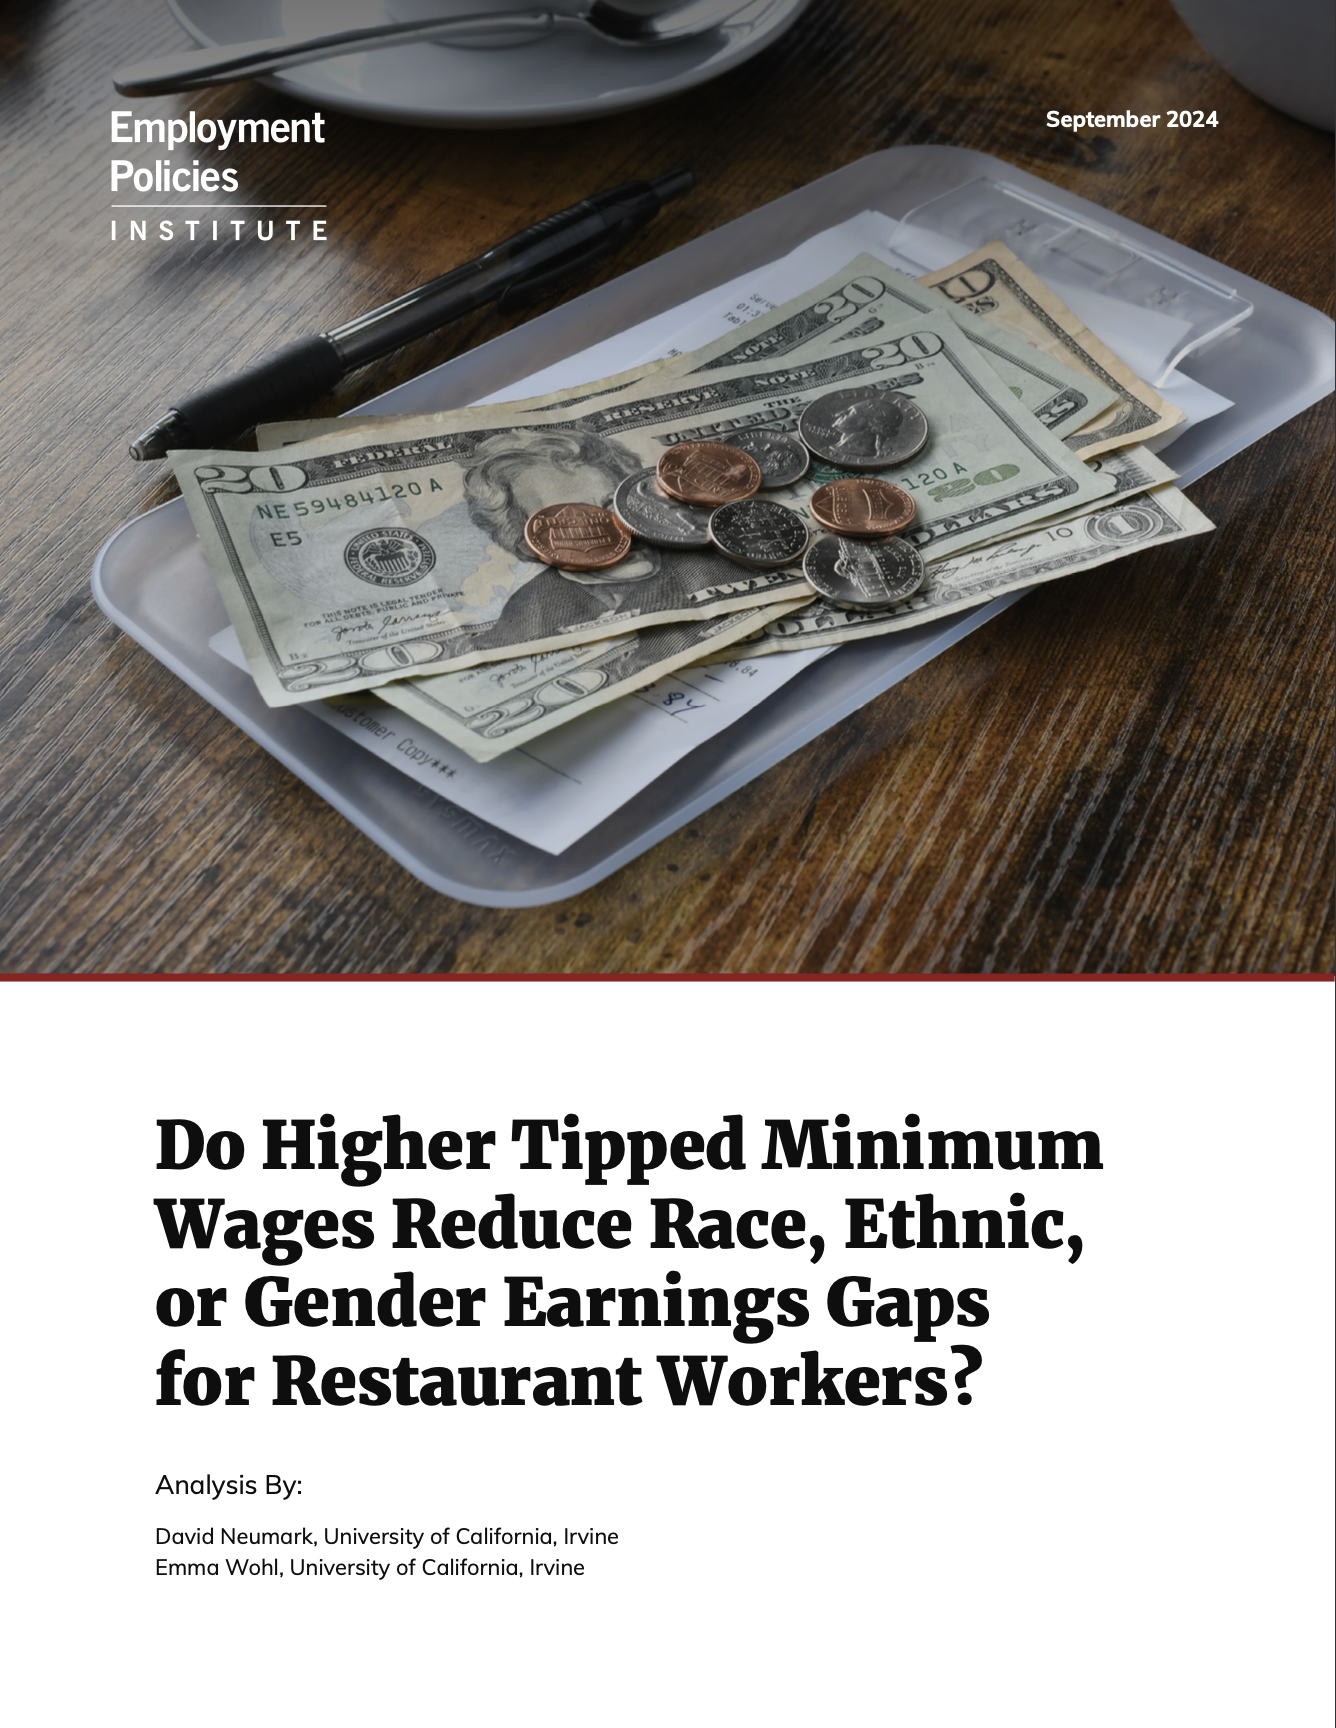
Tipped Wage Analysis
Investigation into how higher tipped wages affect race, ethnic, and gender earnings gaps for restaurant workers.
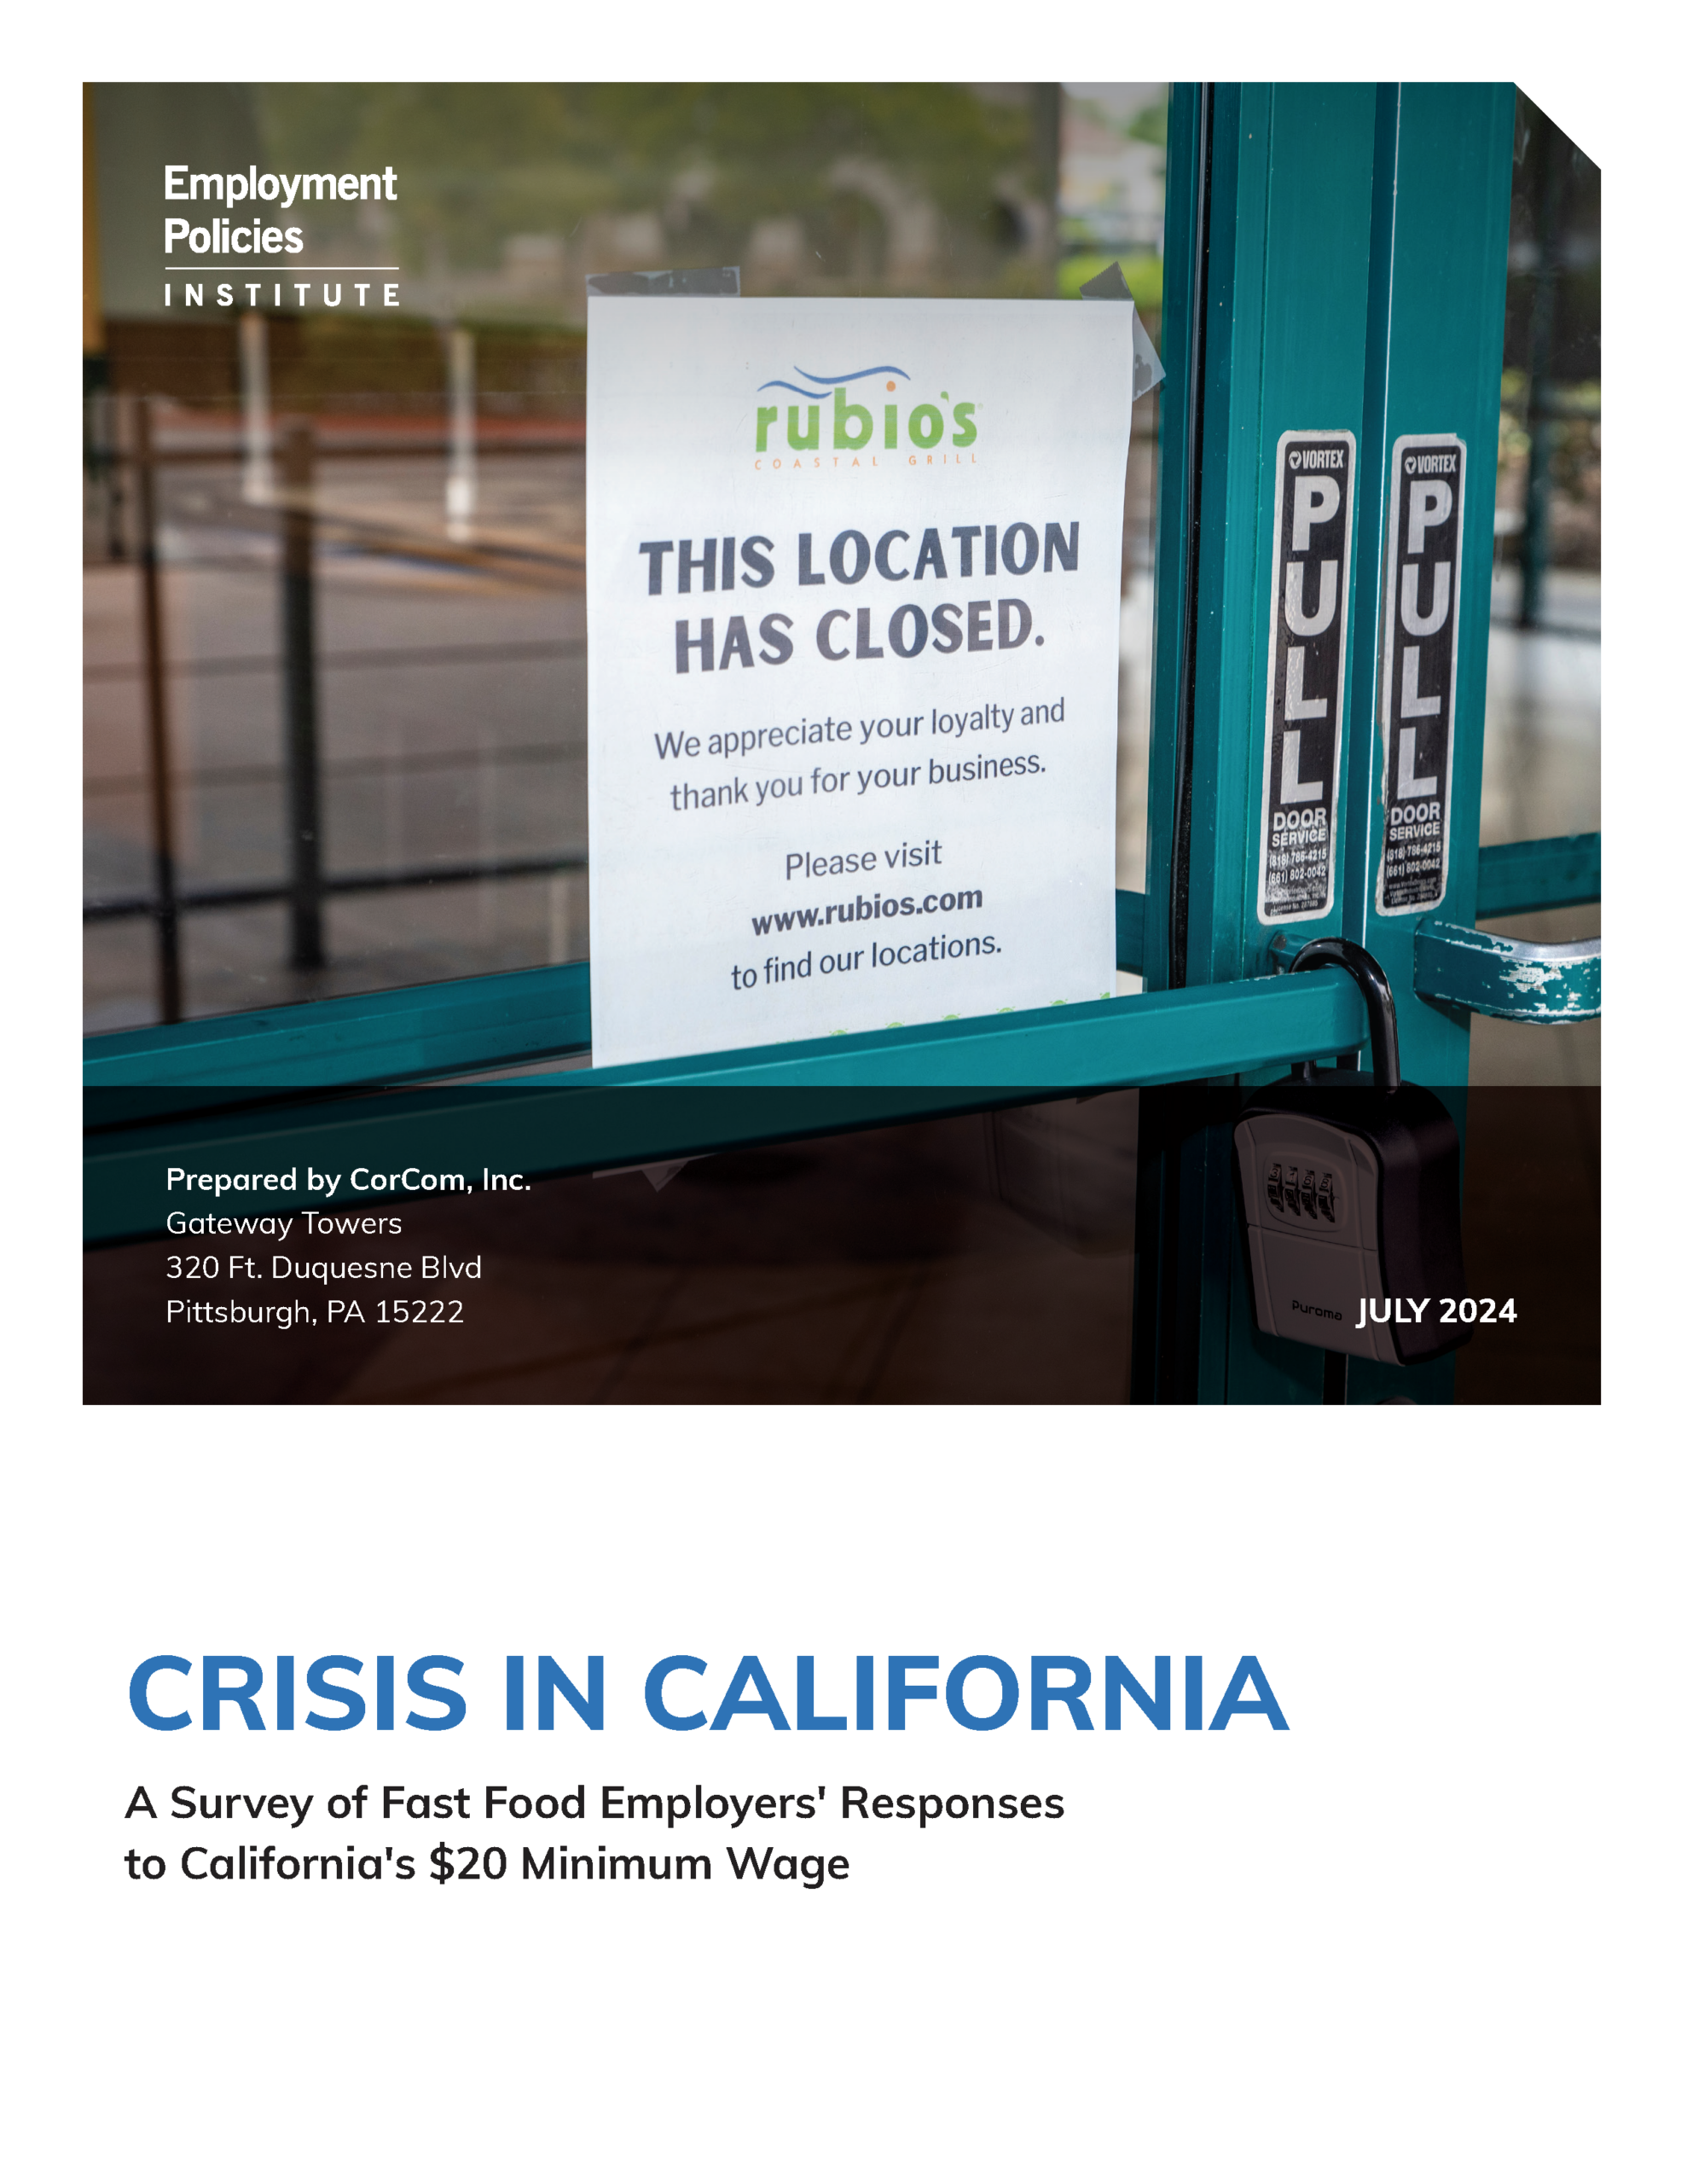
Fast Food Employer Responses Survey
A survey assessing how fast food employers in California are reacting to the $20 minimum wage.
Our Programs

MinimumWage.com
A project providing facts about raising the minimum wage and its effects on employees and employers.
Learn More
TippedWage.com
A platform focused on the minimum wage for employees who earn tip income, highlighting the effects of tip credit elimination.
Learn More
Faces of $15
An initiative illustrating the real-world consequences of raising the minimum wage.
Learn MoreMIP Score (Beta)
The MIP Score is in beta! We'd love any feedback you may have.
The MIP Score and it's methodology is purely used as a way to visualize how a nonprofits public financial data compares against others. It doesn't reflect the unique circumstances and impact that a nonprofit has.The MIP Score should never be used to say one charity is better than another.
Overall Score
64
58
/100
Program Expense Ratio
90.92%
20
/20
Program Revenue Growth
0.00%
2
/20
Leverage Ratio
0.0686
20
/20
Working Capital Ratio
1.757
14
/20
Fundraising Efficiency
0
2
/20
Latest Filing Data: Form 990
Fiscal Year:2022
Source:Source: Self-reported by organization
Financial Details
Revenue
| Category | Amount | Percentage |
|---|---|---|
| Contributions, Gifts, and Grants | 933K | 96.82% |
| Program Services | 0 | 0.00% |
| Investment Income | 58 | 0.01% |
| Sales of Non-Inventory Assets | 0 | 0.00% |
| Other Notable Sources | 30.57K | 3.17% |
| Total Revenue | 963.6K | 100.00% |
Related Nonprofits
Senior Resources of Freeborn County
Social Science
Workplace Social ScienceMk Level Playing Field Institute
Social Science
Workplace Social ScienceNational Center of Kinlein
Social Science
Workplace Social ScienceStudent Pugwash USA
Social Science
Workplace Social ScienceAmerican Society for Psychical Research Inc.
Social Science
Workplace Social Science