Mission
Better Vision Better Hope is dedicated to making vision care services accessible to the underserved and underinsured communities, improving their chances to contribute back to their communities and families through education, employment, or life skills.
Basic Information
Tax-Exempt
Founded in
2013
EIN
46-3723564
Total Assets
$78.76 thousand
UN Sustainable Development Goals Supported
This organization contributes to the following United Nations Sustainable Development Goals. See the SDG page for more information.
Showing 3 of 3 goals
At a Glance
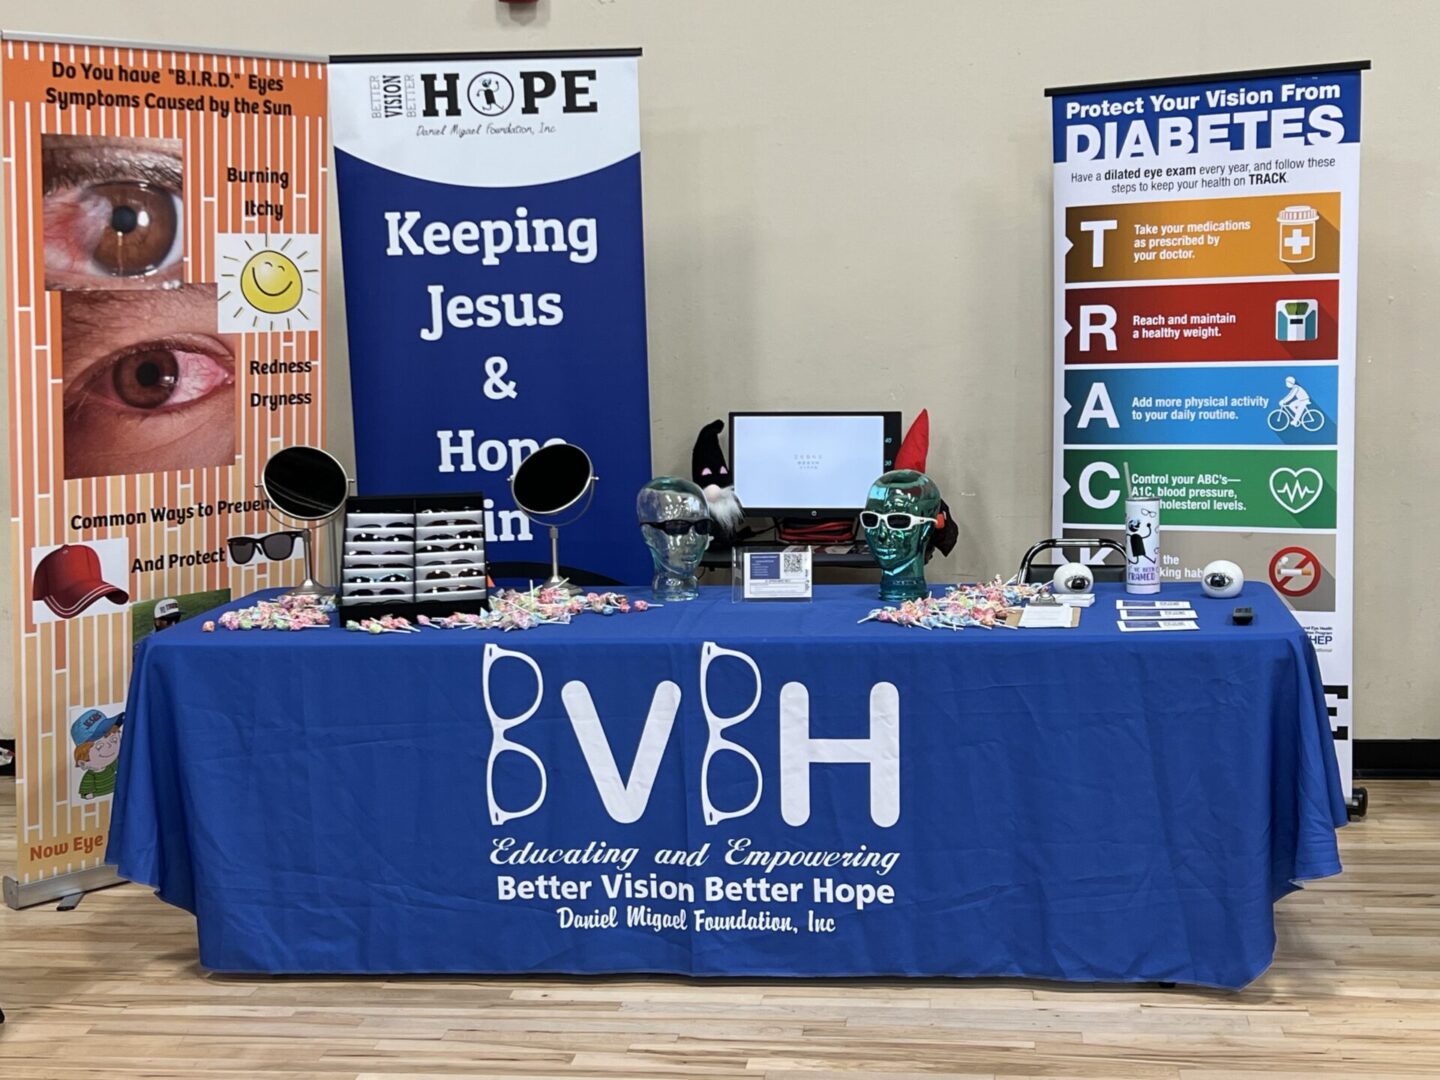
Community Vision Clinic
Monthly community vision clinics providing free eye exams and glasses.
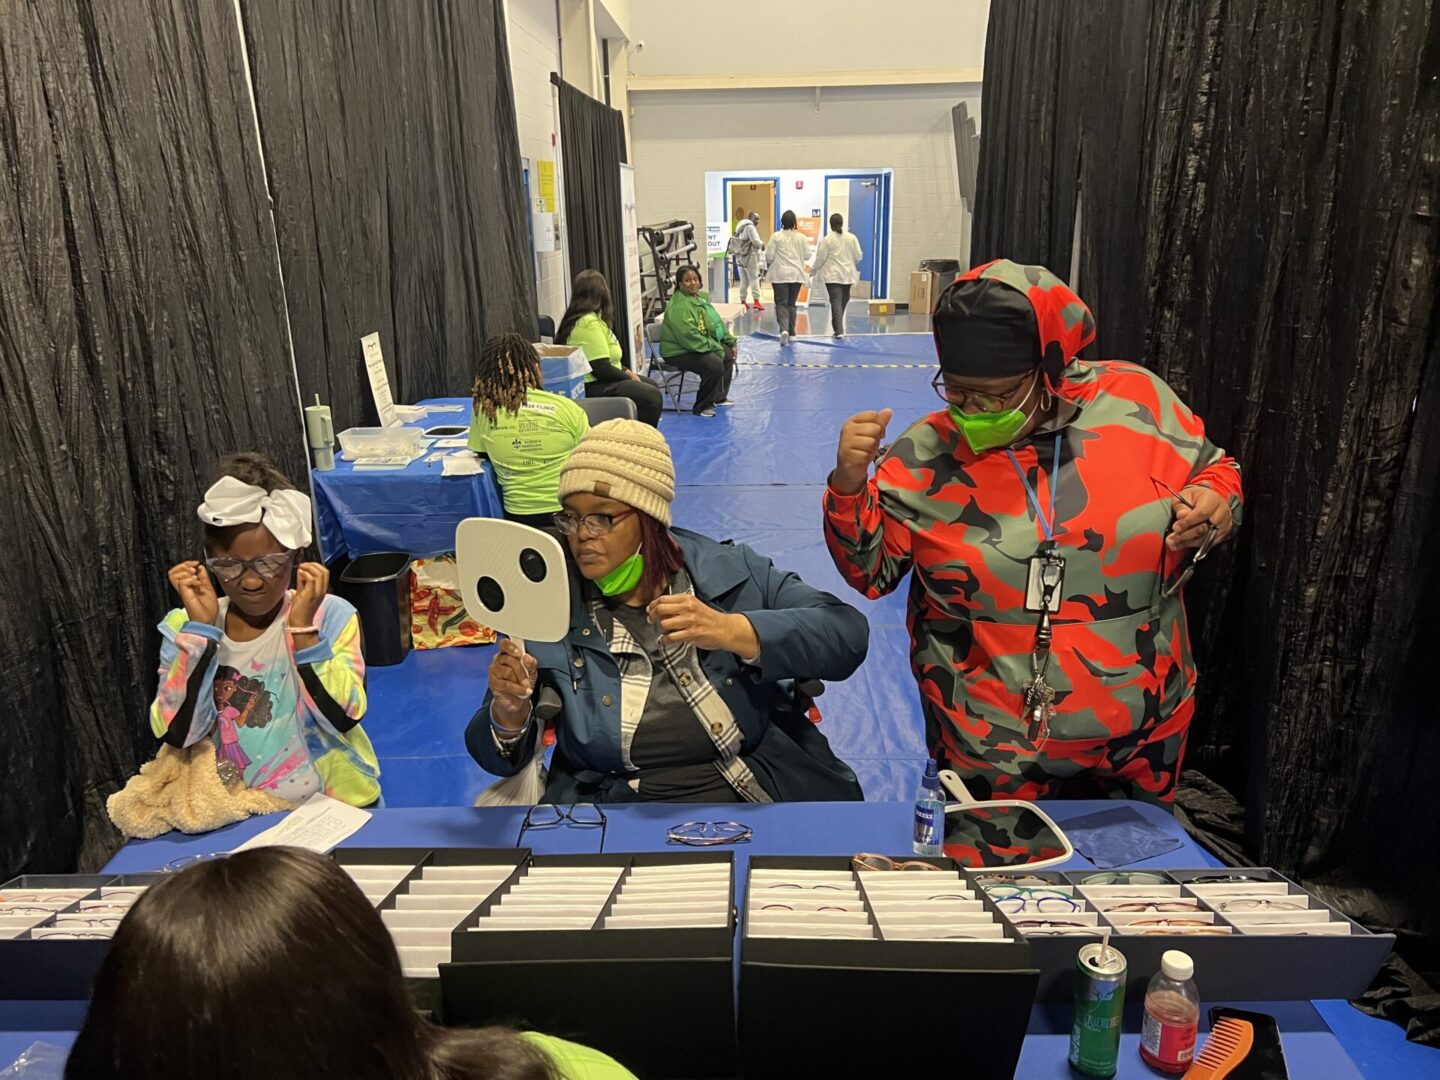
Mobile Vision Clinics
Traveling clinics providing vision care to underserved areas.
Optical Training Program
Training program to empower young adults in becoming optical professionals.
Impact Stats
1942
Patients Served
Patients Seen in 2024
Total number of patients seen in the year 2024.
4498
Glasses Dispensed
Glasses Dispensed in 2024
Total number of glasses dispensed in the year 2024.
$1,204,308
Value of Services
Value of Vision Services in 2024
Total monetary value of vision services provided in the year 2024.
Past Events
True Worth Place Clinic
November 2022
Provided vision care at True Worth Place as part of our monthly clinic.
Rivertree Academy Outreach
November 2022
Serviced a mobile vision clinic at Rivertree Academy.
ChriCinn Outreach Dallas Clinic
December 2022
Hosted a holiday optical outreach at ChriCinn.
Our Programs
Vision Screening and Care
Providing vision screening and dispensing free prescription glasses.
Learn MoreMIP Score (Beta)
The MIP Score is in beta! We'd love any feedback you may have.
The MIP Score and it's methodology is purely used as a way to visualize how a nonprofits public financial data compares against others. It doesn't reflect the unique circumstances and impact that a nonprofit has.The MIP Score should never be used to say one charity is better than another.
Overall Score
38
38
/100
Program Expense Ratio
76.52%
10
/20
Program Revenue Growth
0.00%
2
/20
Leverage Ratio
0.01348
20
/20
Working Capital Ratio
0.2679
4
/20
Fundraising Efficiency
0
2
/20
Latest Filing Data: Form 990
Fiscal Year:2022
Source:Source: Self-reported by organization
Financial Details
Revenue
| Category | Amount | Percentage |
|---|---|---|
| Contributions, Gifts, and Grants | 158.2K | 52.93% |
| Program Services | 140.9K | 47.14% |
| Investment Income | 0 | 0.00% |
| Sales of Non-Inventory Assets | -213 | -0.07% |
| Other Notable Sources | 0 | 0.00% |
| Total Revenue | 298.8K | 100.00% |