Mission
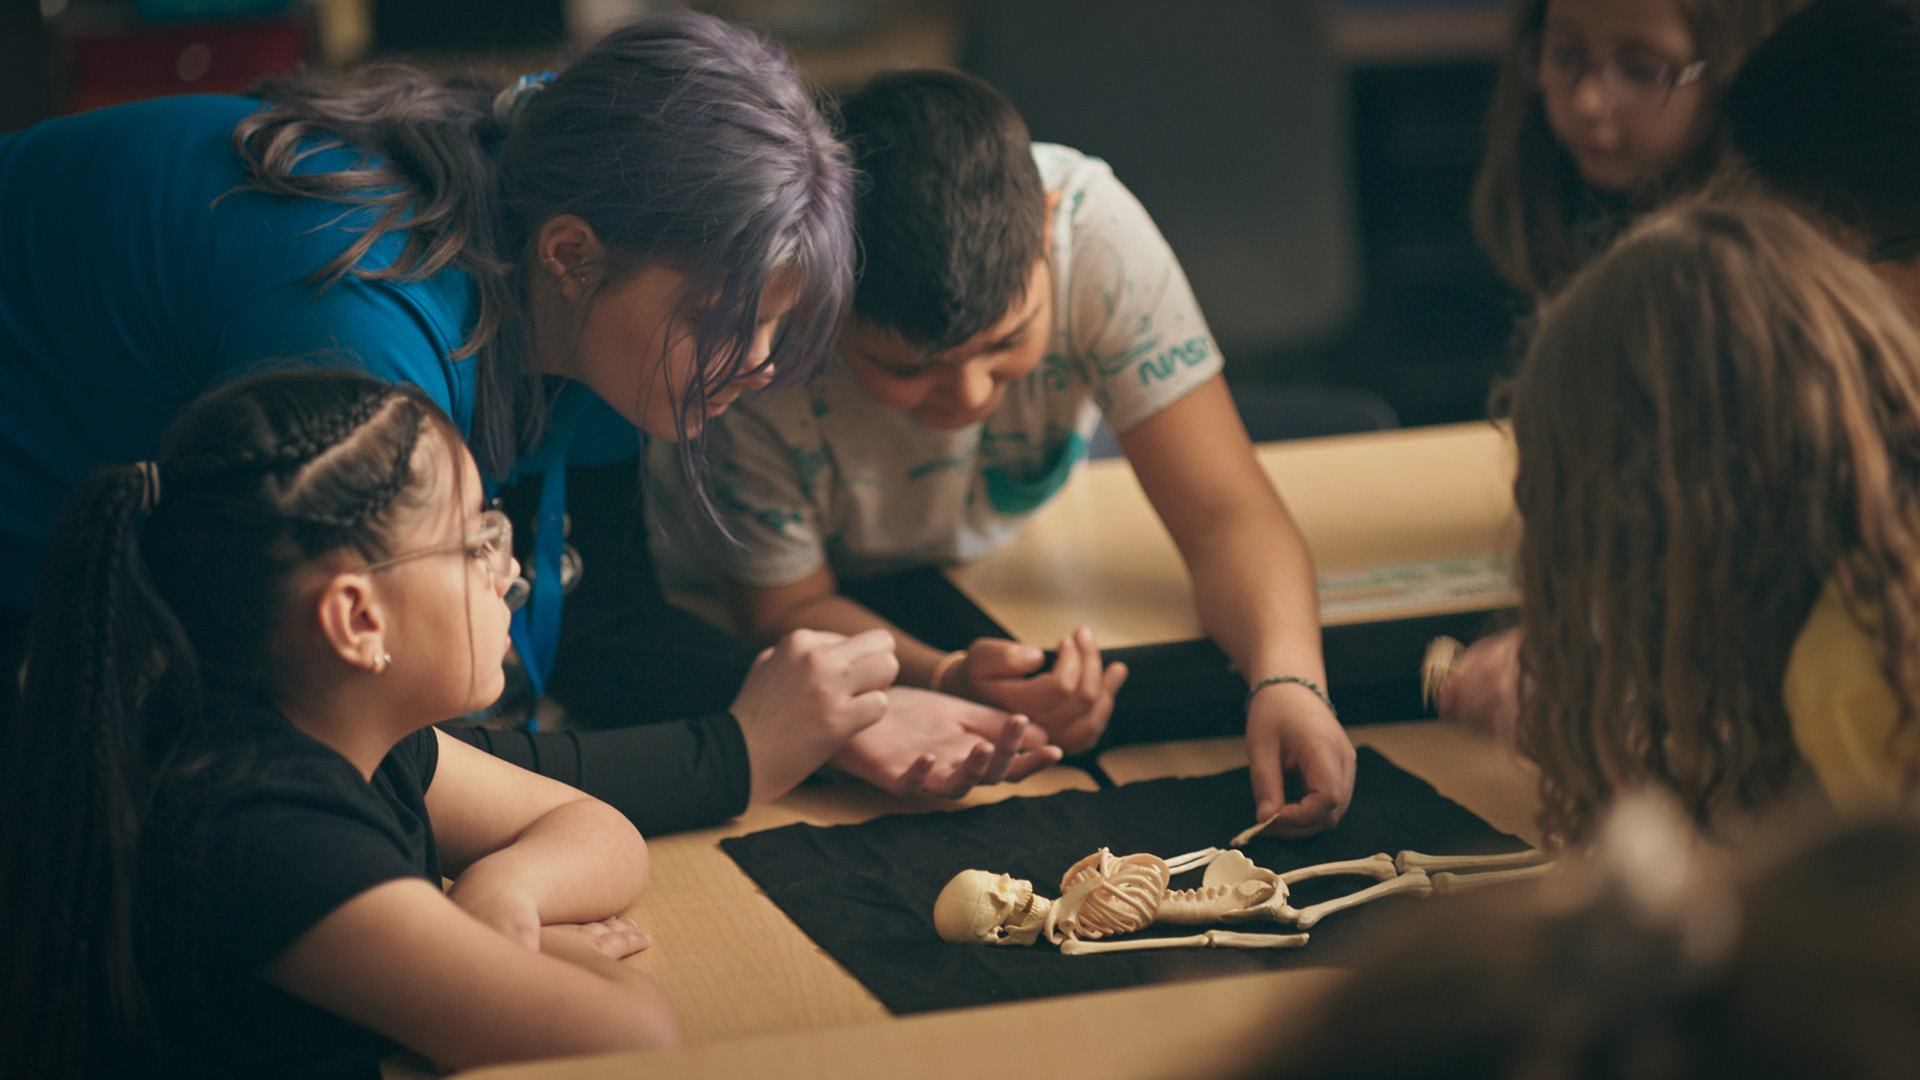
Pacific Science Center is an independent, not-for-profit institution that has been igniting curiosity for over 60 years, since its founding as the nation’s first science and technology center at the 1962 World’s Fair in Seattle. It offers engaging experiences and resources aimed at expanding access to science education, supporting educators, and fostering a vibrant community of inquiry and exploration.
Basic Information
Tax-Exempt
Founded in
1962
EIN
91-0750867
Total Assets
$49.78 million
UN Sustainable Development Goals Supported
This organization contributes to the following United Nations Sustainable Development Goals. See the SDG page for more information.
Showing 3 of 3 goals
At a Glance

Curiosity at Home
Explore hands-on STEM activities and resources available for families.

Science on Wheels
Experience interactive workshops and live shows brought directly to your community.

Digital Discovery Workshops
Enjoy synchronous science lessons led by skilled educators via online platforms.
Impact Stats
400K
Total Guests
Guests Visited
More than 400,000 guests experienced Pacific Science Center's offerings last year.
95K+
Total Students
Students Engaged
Over 95,000 students participated in science education programs like Science on Wheels and field trips.
339
Total Scholarships
Camp Scholarships
339 camp scholarships provided for attendees at Camps for Curious Minds.
Past Events
Member-Exclusive Brainy Bodies Exhibit Preview
December 14, 2024
A special preview for members of the 'Brainy Bodies' exhibit.
Laser Show the Musical
November 27, 2024
Celebratory laser shows featuring musical favorites.
T. rex 3D Experience
Available Now
A special IMAX showing of the documentary film 'T. rex'.
Our Programs
MIP Score (Beta)
The MIP Score is in beta! We'd love any feedback you may have.
The MIP Score and it's methodology is purely used as a way to visualize how a nonprofits public financial data compares against others. It doesn't reflect the unique circumstances and impact that a nonprofit has.The MIP Score should never be used to say one charity is better than another.
Overall Score
76
70
/100
Program Expense Ratio
74.64%
10
/20
Program Revenue Growth
276.72%
20
/20
Leverage Ratio
0.3245
12
/20
Working Capital Ratio
1.471
12
/20
Fundraising Efficiency
0.4493
16
/20
Latest Filing Data: Form 990
Fiscal Year:2022
Source:Source: Self-reported by organization
Financial Details
Revenue
| Category | Amount | Percentage |
|---|---|---|
| Contributions, Gifts, and Grants | 9.654M | 54.87% |
| Program Services | 7.392M | 42.01% |
| Investment Income | 435.1K | 2.47% |
| Sales of Non-Inventory Assets | -501.4K | -2.85% |
| Other Notable Sources | 38.16K | 0.22% |
| Total Revenue | 17.59M | 100.00% |
Related Nonprofits
Pinball Edu
Arts & Culture
Science Education ExhibitsPensacola Mess Hall
Arts & Culture
Science Education ExhibitsAshtabula Maritime & Surface Transportation Museum Inc.
Arts & Culture
Science Education ExhibitsScience Center of Iowa
Arts & Culture
Science Education ExhibitsJunkyard Social Club
Arts & Culture
Science Education Exhibits