Mission
Tonika Lewis Johnson's Folded Map™ Project is a multimedia exploration that investigates urban segregation in Chicago through photography and video interviews. It invites audiences to engage in difficult discussions surrounding social, racial, and institutional segregation in the city, aiming to foster understanding and dialogue about potential solutions to these challenges.
Basic Information
Tax-Exempt
Founded in
2020
EIN
85-1098411
Total Assets
$102.7 thousand
UN Sustainable Development Goals Supported
This organization contributes to the following United Nations Sustainable Development Goals. See the SDG page for more information.
Showing 2 of 2 goals
At a Glance
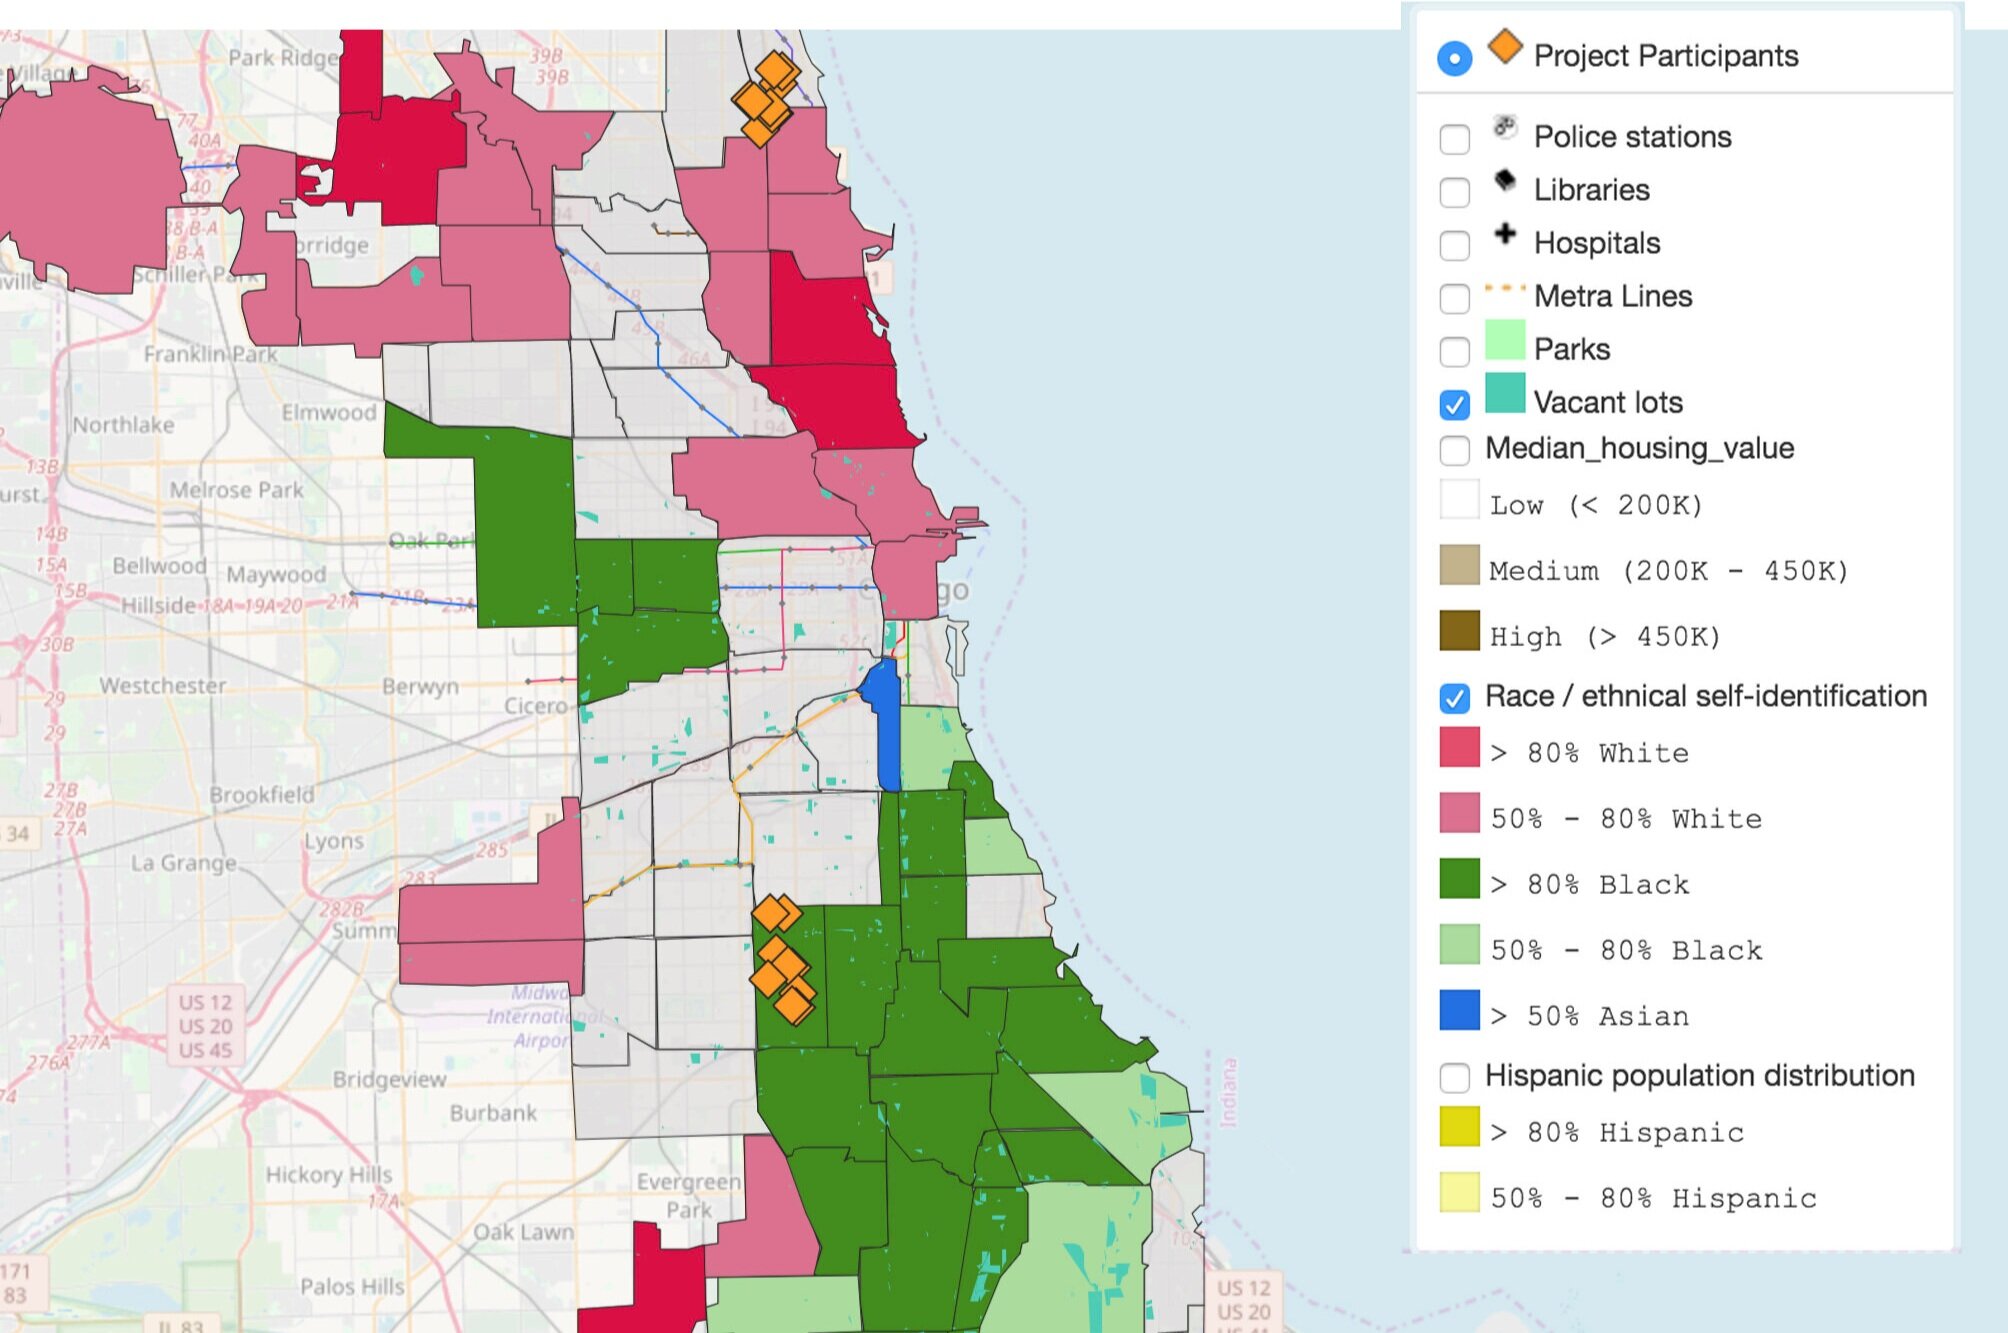
Interactive Maps
Explore demographic differences and business access within segregated neighborhoods through interactive maps.
Folded Map Movie
A documentary that delves into the project's inspirations and significance, available for free.

Address Pairs
Photographic comparisons of addresses on opposite sides of the city highlight the stark contrasts of life.
Impact Stats
2020
Year Implemented
Award-Winning Curriculum
Development of a curriculum that helps educators discuss urban segregation with students.
2017
Year Awarded
Chicagoan of the Year
Recognition by Chicago Magazine for outstanding contribution to the art and social justice field.
1000+
Attendance
Exhibition at LUMA
The project's debut exhibition at Loyola University's Museum of Art.
Past Events
Folded Map Exhibition at LUMA
2018-07-01
Exhibition of the Folded Map project showcasing the impact of segregation through multimedia.
Film Festival Screening
2020-09-15
Screening of the Folded Map documentary at Chicago's South Side Film Festival.
Our Programs
Folded Map Curriculum
A comprehensive curriculum designed for educators to discuss urban segregation with students.
Learn MoreMap Twins Project
Engaging residents of different neighborhoods to converse and share experiences.
MIP Score (Beta)
The MIP Score is in beta! We'd love any feedback you may have.
The MIP Score and it's methodology is purely used as a way to visualize how a nonprofits public financial data compares against others. It doesn't reflect the unique circumstances and impact that a nonprofit has.The MIP Score should never be used to say one charity is better than another.
Overall Score
36
32
/100
Program Expense Ratio
94.70%
20
/20
Program Revenue Growth
0.00%
2
/20
Leverage Ratio
0
2
/20
Working Capital Ratio
0.4651
6
/20
Fundraising Efficiency
0
2
/20
Latest Filing Data: Form 990
Fiscal Year:2022
Source:Source: Self-reported by organization
Financial Details
Revenue
| Category | Amount | Percentage |
|---|---|---|
| Contributions, Gifts, and Grants | 218.5K | 100.00% |
| Program Services | 0 | 0.00% |
| Investment Income | 0 | 0.00% |
| Sales of Non-Inventory Assets | 0 | 0.00% |
| Other Notable Sources | 0 | 0.00% |
| Total Revenue | 218.5K | 100.00% |