Mission
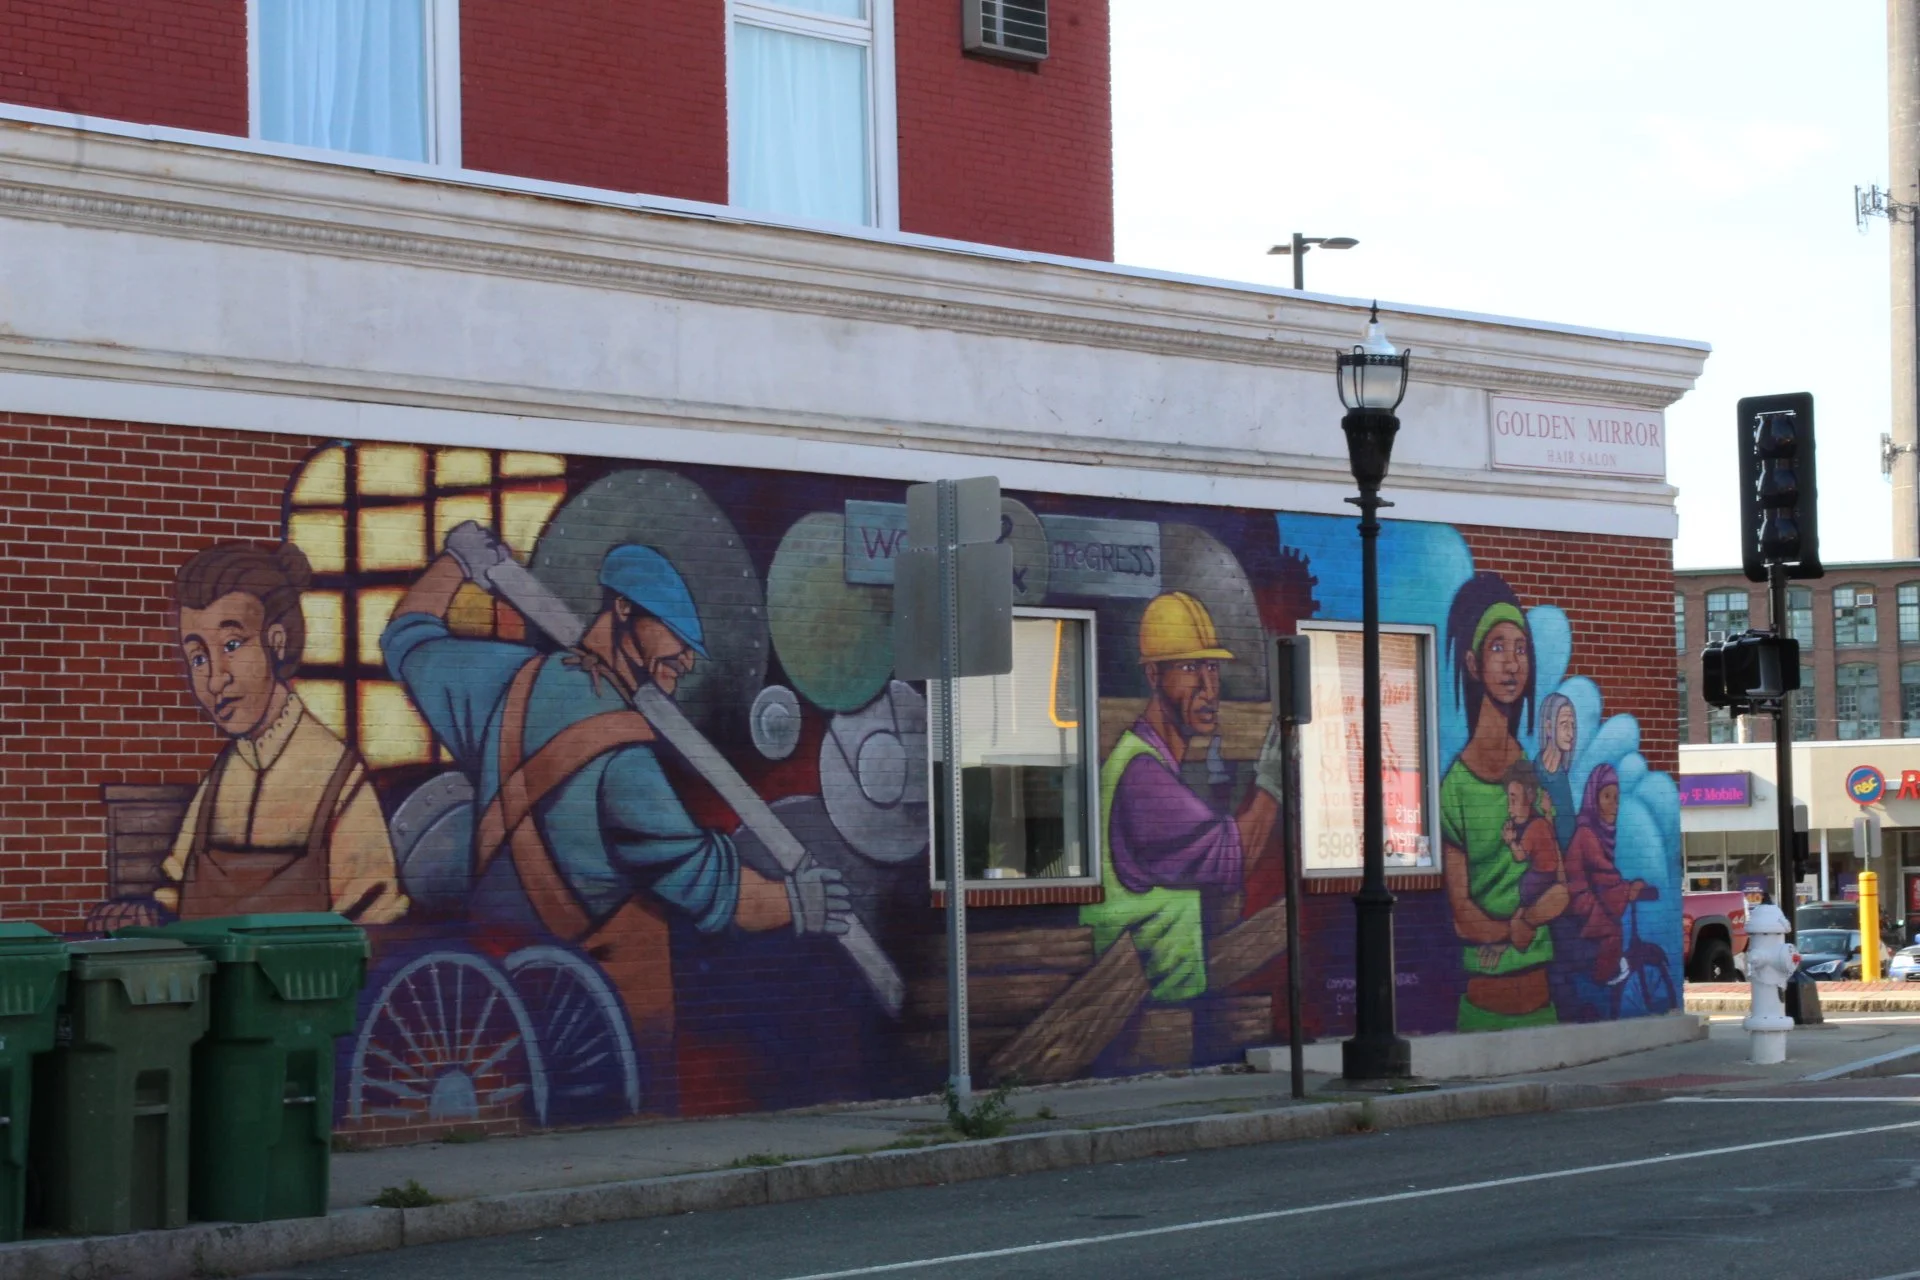
Common Wealth Murals (CWM) is a leading public art organization based in Springfield, MA, that facilitates the creation of murals and other public art projects. Since 2019, CWM has created over 40 murals through a community-engaged process involving thousands of residents. CWM is also dedicated to training emerging artists, particularly from BIPOC backgrounds, and is the co-founder of the Community Mural Institute.
Basic Information
Tax-Exempt
Founded in
2018
EIN
83-2022617
Total Assets
$65.68 thousand
UN Sustainable Development Goals Supported
This organization contributes to the following United Nations Sustainable Development Goals. See the SDG page for more information.
Showing 2 of 2 goals
At a Glance

Fresh Paint Springfield Festival
An annual mural festival celebrating local art and community engagement.

Community Mural Institute
Training program for emerging muralists focused on community-engaged techniques.

Graffiti Jam Events
An event series celebrating street art and community involvement.
Impact Stats
40+
Murals Created
Community Engagement
Facilitated the design and painting of over 40 murals with community participation.
60%
Percentage of BIPOC Artists
BIPOC Representation
Provided training and opportunities for artists, with a focus on BIPOC and women.
4x
Economic Return
Economic Impact
Generated significant economic activity through mural installations and events.
Our Programs
Community Mural Institute
An intensive training program for emerging muralists focused on community engagement.
Learn MoreMIP Score (Beta)
The MIP Score is in beta! We'd love any feedback you may have.
The MIP Score and it's methodology is purely used as a way to visualize how a nonprofits public financial data compares against others. It doesn't reflect the unique circumstances and impact that a nonprofit has.The MIP Score should never be used to say one charity is better than another.
Overall Score
52
48
/100
Program Expense Ratio
88.06%
20
/20
Program Revenue Growth
-41.50%
2
/20
Leverage Ratio
0.04531
20
/20
Working Capital Ratio
0.195
4
/20
Fundraising Efficiency
0
2
/20
Latest Filing Data: Form 990
Fiscal Year:2022
Source:Source: Self-reported by organization
Financial Details
Revenue
| Category | Amount | Percentage |
|---|---|---|
| Contributions, Gifts, and Grants | 178K | 51.22% |
| Program Services | 169.5K | 48.78% |
| Investment Income | 0 | 0.00% |
| Sales of Non-Inventory Assets | 0 | 0.00% |
| Other Notable Sources | 0 | 0.00% |
| Total Revenue | 347.5K | 100.00% |