Mission
The Water Collaborative works to ensure water management in the Greater New Orleans Region is climate resilient, affordable, and clean, engaging a diverse network to address water-related challenges and maximize the benefits of green infrastructure.
Basic Information
Tax-Exempt
Founded in
2016
EIN
82-3230968
Total Assets
$0
UN Sustainable Development Goals Supported
This organization contributes to the following United Nations Sustainable Development Goals. See the SDG page for more information.
Showing 3 of 3 goals
At a Glance

Water Quality Testing in Cancer Alley
A study on PFAS and heavy metals in Louisiana's Cancer Alley, promoting awareness about water pollution.
Water Justice New Orleans
Community-led processes for an equitable stormwater fee in New Orleans.
Water Quality Testing in Orleans Parish
Research on lead and copper contamination in New Orleans drinking water.
Impact Stats
1
Response to Crisis
Water Shut-off Moratorium
Petitioned Sewerage and Water Board to enact a moratorium on water shut-offs during Covid-19.
1
Introduced Programs
Water Affordability Pilot
Supported the creation of Sewerage and Water Board’s first ever water affordability and payment program pilot.
Past Events
Water Quality Testing in Cancer Alley
2022
A community-led water quality testing initiative aimed at addressing pollution concerns in Cancer Alley.
Upcoming Events
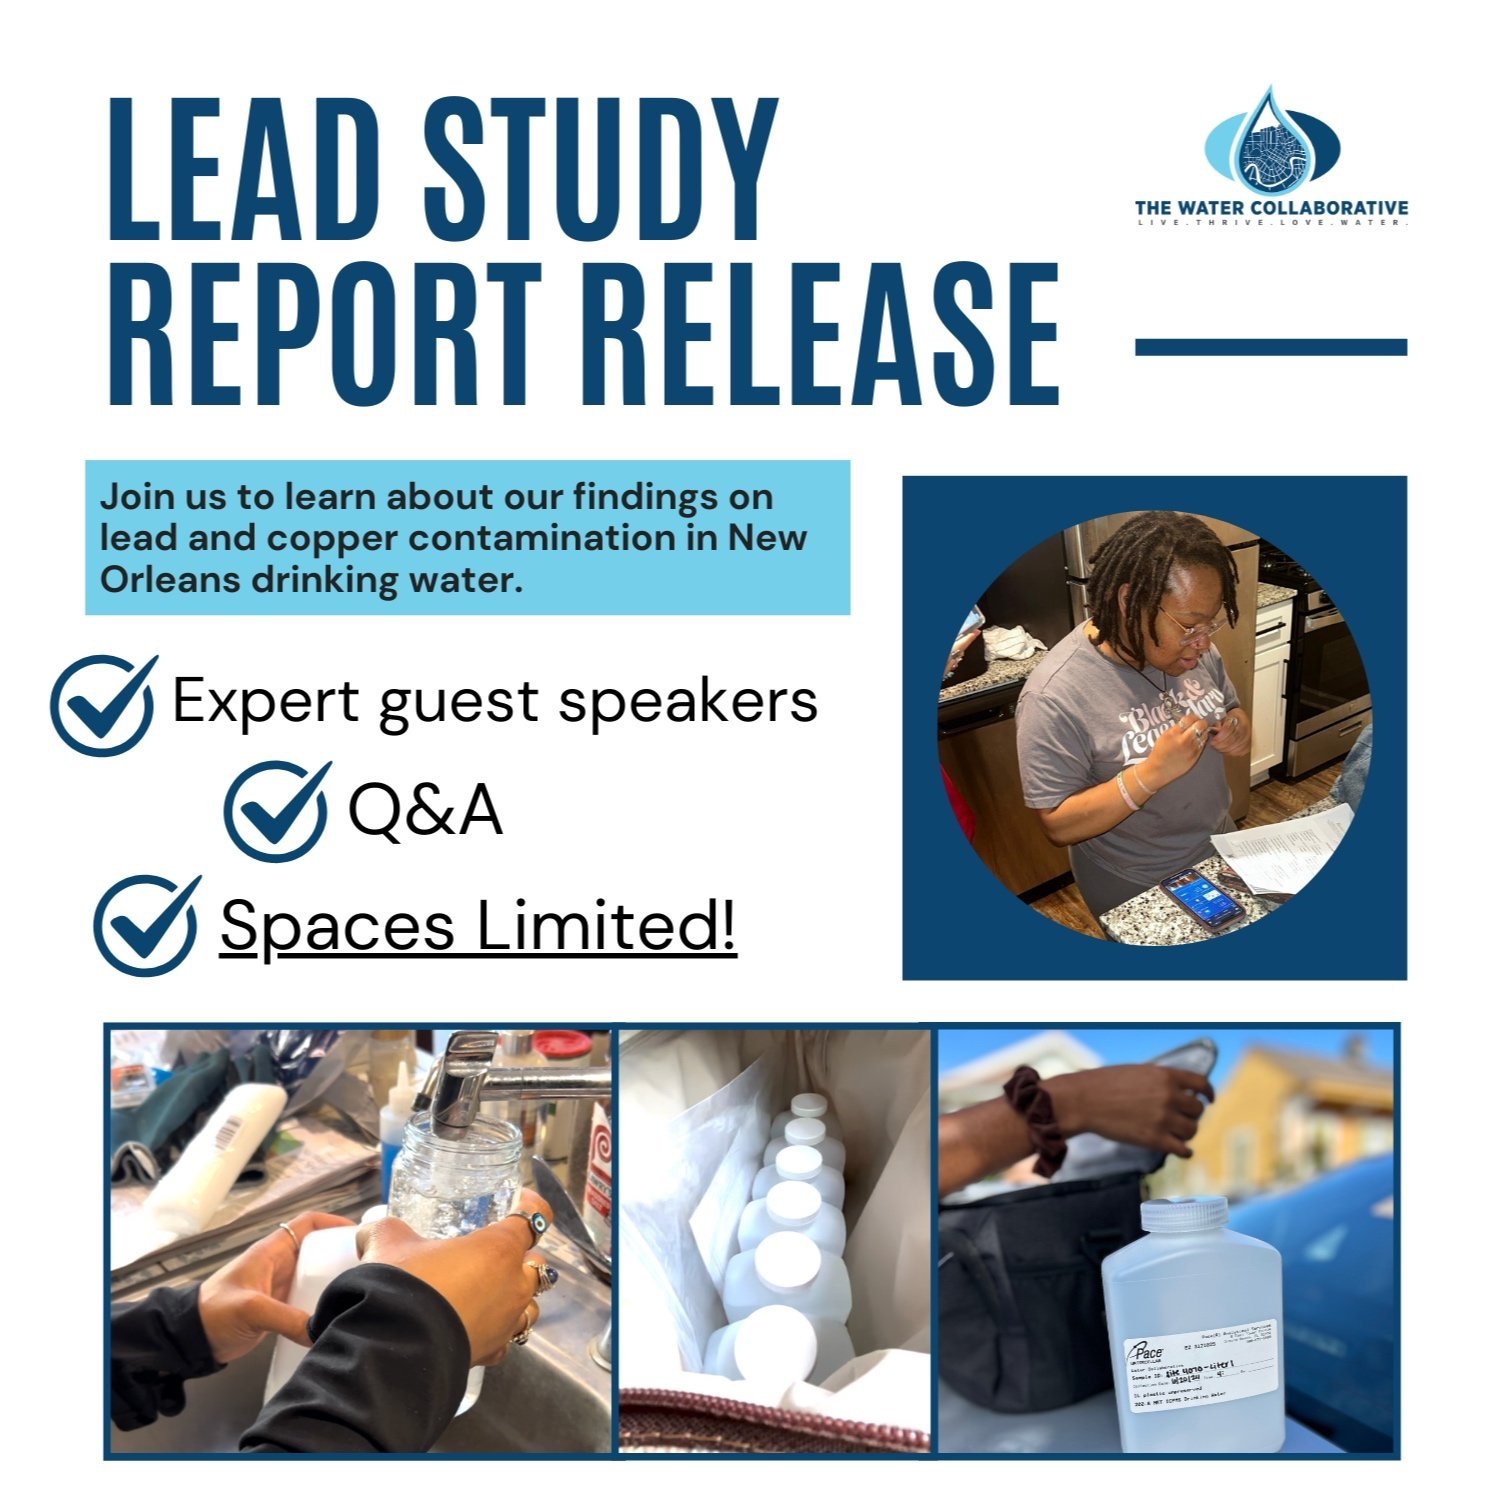
New Orleans Lead Study Report Release
2024-10-12
Join us to talk about lead and copper contamination in New Orleans drinking water.
Learn More
Life's a Drag - Dip & Donate Fundraiser
2024-06-08
A fundraising event to support The Water Collaborative's initiatives.
Learn More
Lunch & Learn: Free Mapping Tool and Informational Session
2024-04-11
Join us for a session to explore resources for green infrastructure planning.
Learn MoreOur Programs
Water Quality Testing in Cancer Alley
COVID-19-driven community water testing for PFAS and heavy metals.
Learn MoreMIP Score (Beta)
The MIP Score is in beta! We'd love any feedback you may have.
The MIP Score and it's methodology is purely used as a way to visualize how a nonprofits public financial data compares against others. It doesn't reflect the unique circumstances and impact that a nonprofit has.The MIP Score should never be used to say one charity is better than another.
Overall Score
44
26
/100
Program Expense Ratio
14.92%
2
/20
Program Revenue Growth
0.00%
2
/20
Leverage Ratio
0
2
/20
Working Capital Ratio
0
2
/20
Fundraising Efficiency
0.2473
18
/20
Latest Filing Data: Form 990
Fiscal Year:2021
Source:Source: Self-reported by organization
Financial Details
Revenue
| Category | Amount | Percentage |
|---|---|---|
| Contributions, Gifts, and Grants | 259.8K | 99.99% |
| Program Services | 0 | 0.00% |
| Investment Income | 0 | 0.00% |
| Sales of Non-Inventory Assets | 0 | 0.00% |
| Other Notable Sources | 15 | 0.01% |
| Total Revenue | 259.9K | 100.00% |
Related Nonprofits
Tree of Knowledge
Environment
General Environmental ServicesCyclists of the Gitchee Gumee Shores Inc.
Environment
General Environmental ServicesResource Media A Nonprofit Corporation
Environment
General Environmental ServicesMakesoil
Environment
General Environmental ServicesInterlace Commons Inc.
Environment
General Environmental Services