Mission
The Boston Tenants Coalition (BTC) is a coalition of grassroots tenant neighborhood groups, community development corporations, and homeless advocacy organizations that promotes affordable housing in Boston. The BTC involves tenant leaders and housing activists from various constituencies and neighborhoods to defend and expand the rights of tenants, emphasizing that affordable housing needs to be permanent and targeted to Boston’s low-income populations.
Basic Information
Tax-Exempt
Founded in
2003
EIN
81-0616711
Total Assets
$259 thousand
UN Sustainable Development Goals Supported
This organization contributes to the following United Nations Sustainable Development Goals. See the SDG page for more information.
Showing 3 of 3 goals
At a Glance
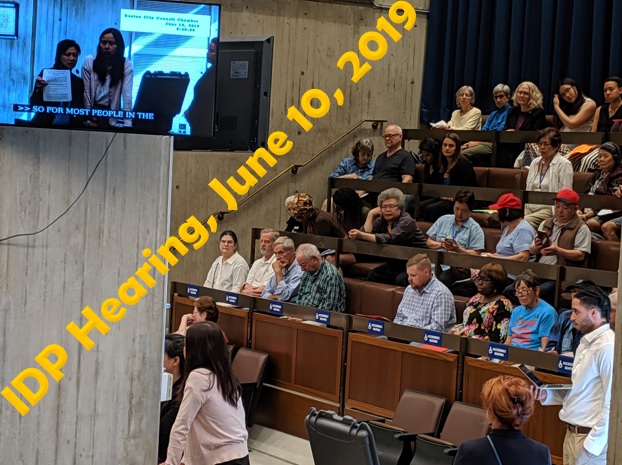
Inclusionary Development Policy Campaign
Campaign advocating for improved inclusionary policies to better serve families in need of affordable housing.

Boston Displacement Mapping
A mapping initiative exploring displacement experiences in Boston amidst the housing crisis.

Immigrant Tenant Support Initiative
Support program for immigrant tenants facing unique challenges in housing.
Impact Stats
$50 million
Funding allocated
Affirmatively Furthering Fair Housing Campaign
Collaborated with city officials to maintain fair housing policies despite federal changes.
10,000
Units targeted
10,000 Affordable Homes Campaign
Ongoing campaign aimed at creating 10,000 units of permanently affordable housing.
Past Events
Testify at City Council Hearing
2022-04-22
City Council hearing regarding affordable housing and development policy.
Our Programs

Michael Stone Scholars Program
Research-driven initiative supporting tenant advocacy and housing justice.
Learn MoreVolunteer Opportunities
Testimonials
"The Boston Tenants Coalition has been life-changing in helping us secure our rights."
Maria Gomez
Tenant Advocate
Impact Reports
MIP Score (Beta)
The MIP Score is in beta! We'd love any feedback you may have.
The MIP Score and it's methodology is purely used as a way to visualize how a nonprofits public financial data compares against others. It doesn't reflect the unique circumstances and impact that a nonprofit has.The MIP Score should never be used to say one charity is better than another.
Overall Score
55
52
/100
Program Expense Ratio
91.01%
20
/20
Program Revenue Growth
0.00%
2
/20
Leverage Ratio
0.08443
20
/20
Working Capital Ratio
0.7483
8
/20
Fundraising Efficiency
0
2
/20
Latest Filing Data: Form 990
Fiscal Year:2021
Source:Source: Self-reported by organization
Financial Details
Revenue
| Category | Amount | Percentage |
|---|---|---|
| Contributions, Gifts, and Grants | 327.2K | 99.94% |
| Program Services | 0 | 0.00% |
| Investment Income | 181 | 0.06% |
| Sales of Non-Inventory Assets | 0 | 0.00% |
| Other Notable Sources | 0 | 0.00% |
| Total Revenue | 327.4K | 100.00% |