Mission
The California Collegiate League (CCL), founded in 1993, is committed to enhancing college baseball by providing a competitive environment for top collegiate athletes during the summer season. With nine teams spanning from Southern to Northern California, CCL facilitates the development of players and nurtures their pathways to professional baseball.
Basic Information
Tax-Exempt
Founded in
2010
EIN
27-1649324
Total Assets
$67.53 thousand
At a Glance
2024 CCL Showcase Game
A premier event featuring the top talents from the league showcasing their skills.

CCL x 2024 Men’s College Baseball World Series
CCL players excelling in one of the biggest events in college baseball.
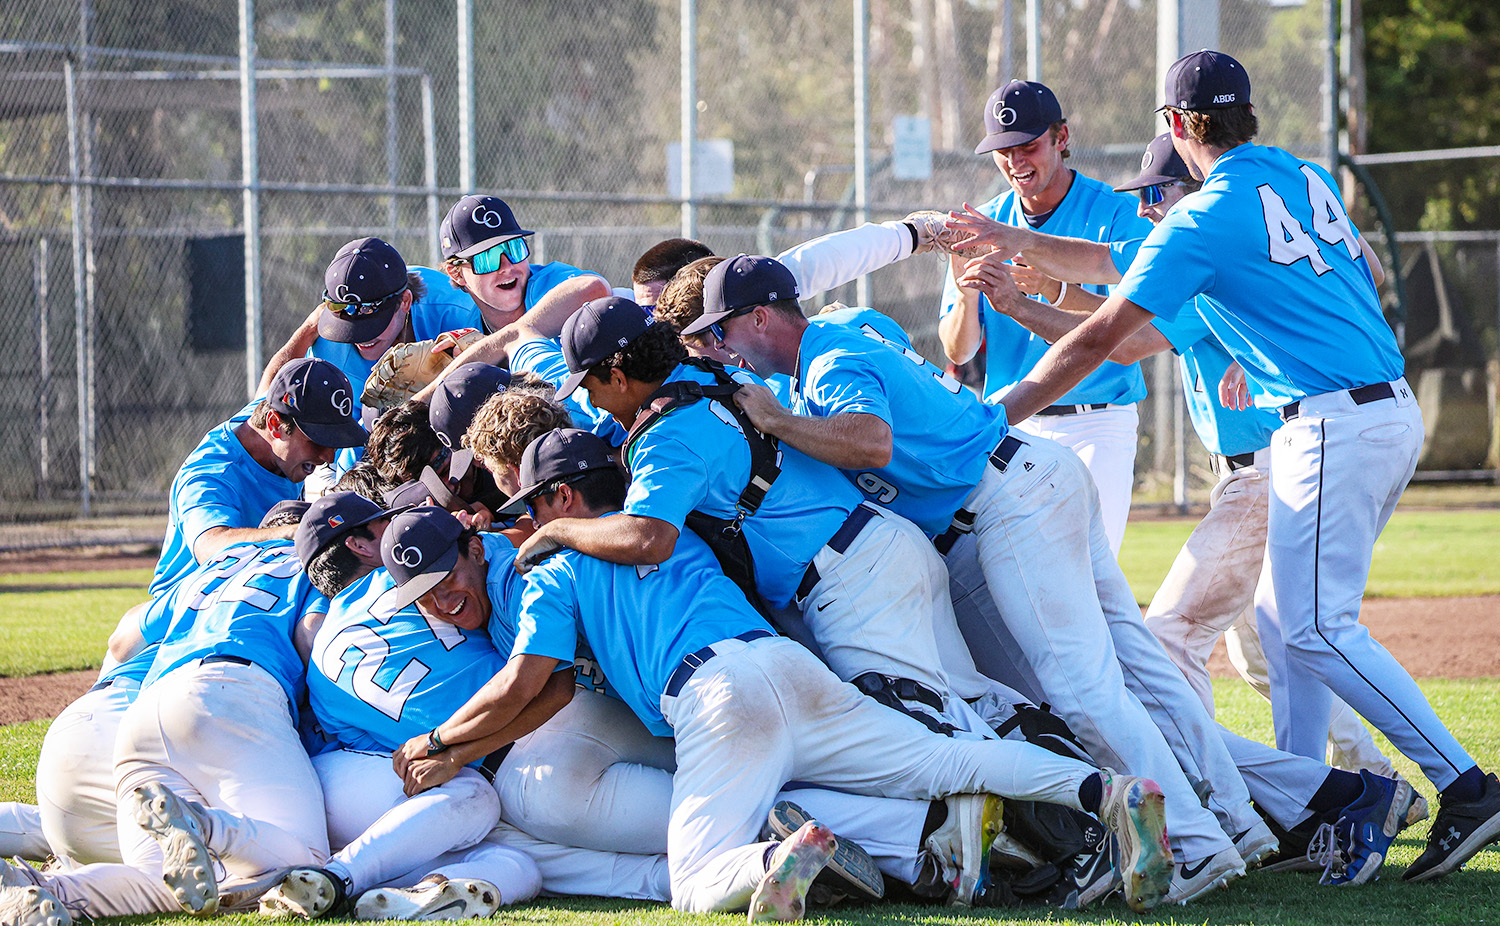
Conejo Oaks Crowned 2024 CCL State Champions
Recap of the Conejo Oaks victory leading to their championship title.
Impact Stats
283
Number of Players
Players Selected in MLB Draft
The CCL has seen a total of 283 players selected in the MLB Draft as of 2023.
9
Teams
Number of Teams
The League consists of 9 competitive teams across various regions in California.
400+
Annual Players
Number of Players Annually
More than 400 players participate in CCL each summer, providing exposure and opportunities.
Past Events
CCL State Championship 2023
August 4-6, 2023
Annual CCL State Championship where teams compete for the title.
CCL 30th Anniversary Celebration
May 2023
The CCL celebrated its 30th anniversary with a series of special events.
CCL 2023 Summer Season
June to August 2023
Regular season games held throughout California showcasing top collegiate talents.
Upcoming Events
2024 CCL Showcase Game
July 17, 2024
Top players will display their skills at the annual showcase event.
Learn More2024 CCL Postseason
August 2024
The culmination of the CCL season where teams compete for championships.
2024 Summer Kickoff
June 6, 2024
Start of the annual summer season for collegiate baseball.
MIP Score (Beta)
The MIP Score is in beta! We'd love any feedback you may have.
The MIP Score and it's methodology is purely used as a way to visualize how a nonprofits public financial data compares against others. It doesn't reflect the unique circumstances and impact that a nonprofit has.The MIP Score should never be used to say one charity is better than another.
Overall Score
48
50
/100
Program Expense Ratio
99.56%
20
/20
Program Revenue Growth
37.00%
18
/20
Leverage Ratio
0.4739
8
/20
Working Capital Ratio
0.105
2
/20
Fundraising Efficiency
0
2
/20
Latest Filing Data: Form 990
Fiscal Year:2021
Source:Source: Self-reported by organization
Financial Details
Revenue
| Category | Amount | Percentage |
|---|---|---|
| Contributions, Gifts, and Grants | 229.3K | 89.12% |
| Program Services | 27.99K | 10.88% |
| Investment Income | 3 | 0.00% |
| Sales of Non-Inventory Assets | 0 | 0.00% |
| Other Notable Sources | 0 | 0.00% |
| Total Revenue | 257.3K | 100.00% |
Related Nonprofits
Zebra Foundation Inc.
Sports & Recreation
Recreation Nonprofit SupportMid Atlantic Officials Association
Sports & Recreation
Recreation Nonprofit SupportMuncie Sports Commission Inc.
Sports & Recreation
Recreation Nonprofit SupportLife Sports Foundation
Sports & Recreation
Recreation Nonprofit SupportPark Management Company Inc.
Sports & Recreation
Recreation Nonprofit Support