Mission
SCK LAUNCH – South Central Kentucky Learning About Unique and New Careers Here – is an overarching talent development strategy to grow our own that begins at the earliest opportunity in kindergarten and carries through to graduation. We believe education is taking the smart approach, providing our young people a wealth of knowledge about engaging careers in South Central Kentucky, focusing on industry certification and preparation for high-demand careers.
Basic Information
Tax-Exempt
Founded in
2006
EIN
20-5509339
Total Assets
$542.8 thousand
UN Sustainable Development Goals Supported
This organization contributes to the following United Nations Sustainable Development Goals. See the SDG page for more information.
Showing 2 of 2 goals
At a Glance

Career Sectors
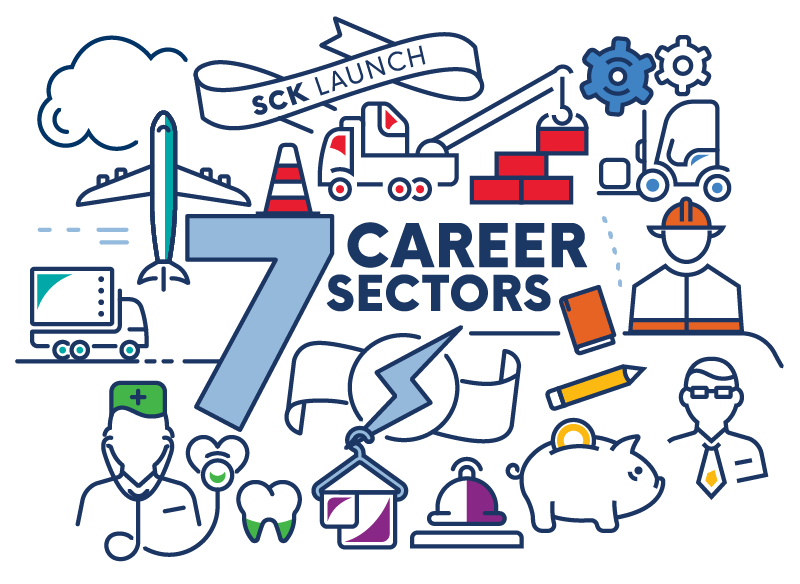
Explore the seven career sectors with the highest potential growth in South Central Kentucky: Construction, Healthcare, Hospitality, Manufacturing, Professional Services, Public Services, and Transportation.
Student-Led Leadership
Students engage in leadership campaigns and projects to promote unity within their school communities.

Senior Job Fair
Connecting graduating seniors with employers in high-wage, high-demand industries.
Impact Stats
1277
Students Engaged
SCK LAUNCH Experience Curriculum
Preparation program for students to explore and connect with local industry leaders.
Our Programs

SCK LAUNCH Experience
An annual hands-on career expo for eighth-graders to explore available careers.
Learn MoreImpact Reports
MIP Score (Beta)
The MIP Score is in beta! We'd love any feedback you may have.
The MIP Score and it's methodology is purely used as a way to visualize how a nonprofits public financial data compares against others. It doesn't reflect the unique circumstances and impact that a nonprofit has.The MIP Score should never be used to say one charity is better than another.
Overall Score
52
46
/100
Program Expense Ratio
66.95%
6
/20
Program Revenue Growth
-29.70%
2
/20
Leverage Ratio
0.07414
20
/20
Working Capital Ratio
3.106
16
/20
Fundraising Efficiency
0
2
/20
Latest Filing Data: Form 990
Fiscal Year:2022
Source:Source: Self-reported by organization
Financial Details
Revenue
| Category | Amount | Percentage |
|---|---|---|
| Contributions, Gifts, and Grants | 58.89K | 37.98% |
| Program Services | 95.69K | 61.72% |
| Investment Income | 462 | 0.30% |
| Sales of Non-Inventory Assets | 0 | 0.00% |
| Other Notable Sources | 0 | 0.00% |
| Total Revenue | 155K | 100.00% |
Related Nonprofits
Columbus Fashion Initiative
Youth Development
Youth Business EducationYouth Venture Inc.
Youth Development
Youth Business EducationSpy Hop Productions Inc.
Youth Development
Youth Business EducationCookie Cart
Youth Development
Youth Business EducationBergens Promise Inc.
Youth Development
Youth Business Education